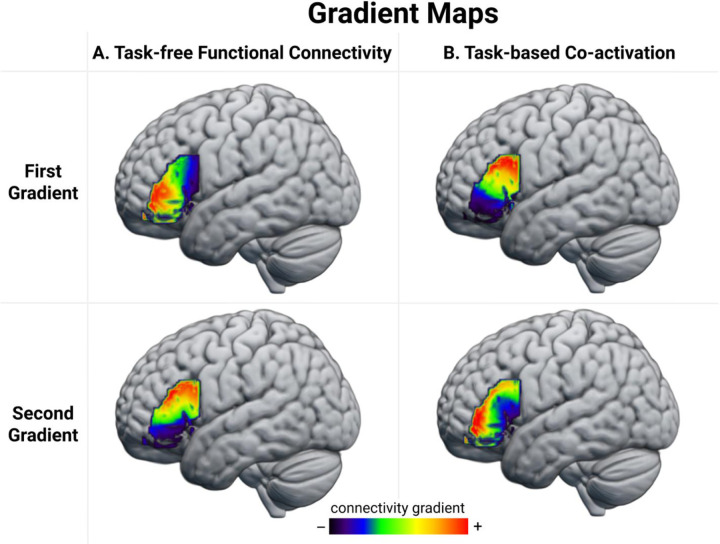
Figure 2.
The first two gradient maps extracted from the A) task-free FC similarity matrix and B) task-based co-activation similarity matrix. Compared to regions represented with colours further apart on the colour spectrum, regions represented using colours that are closer together show greater similarity in their A) correlation with each other over time during resting fMRI scans and B) their patterns of co-activation across tasks spanning a range of cognitive domains. The +/− indicate different poles of these gradient dimensions, but the assignment to a specific end of a dimension is arbitrary. The gradient maps can be accessed at: neurovault.org.

