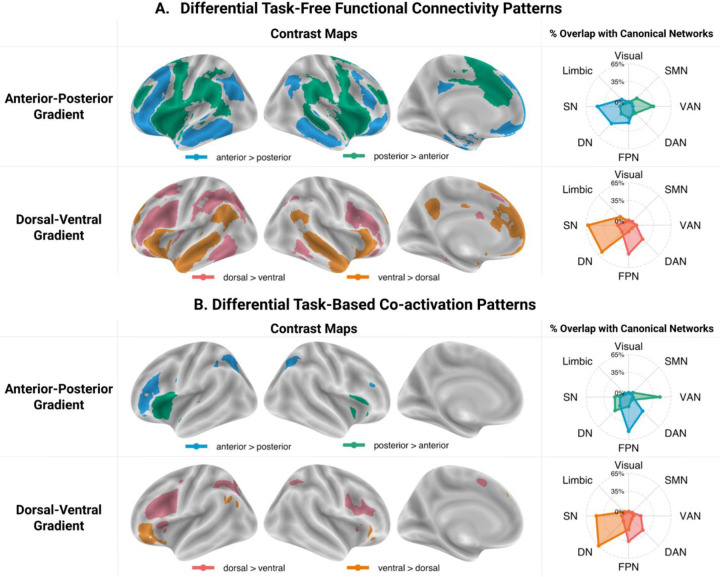
Figure 3.
Results of contrast analyses between A) the task-free connectivity patterns (derived using seed-based resting-state FC analyses) of the IFG clusters located at the extremes of the anterior-posterior and dorsal-ventral task-free gradients and B) task-constrained co-activation patterns (derived using MACM analyses) of the IFG clusters located at the extremes of the anterior-posterior and dorsal-ventral task-based gradients. These contrast maps were masked using cluster-independent maps. The spider plots in the right column show the percentage of voxels in each contrast map that overlap between with each of the seven canonical networks from Yeo et al. (2011), as well as the SN from Jackson et al. (2016) (available at: github.com/JacksonBecky/templates). Note that percentage values are relative to the size of each contrast map; therefore, only the relative patterns of overlaps within each contrast map are of interest and direct comparisons between the network affiliations of different contrast maps are misleading. The contrast maps can be accessed at: neurovault.org/collections/ETPEFCDV/. Abbreviations: SMN - somatomotor network, VAN – bentral attention network; DAN – dorsal attention network; FPN – frontopariental control network; DN – default network; SN – semantic network.

