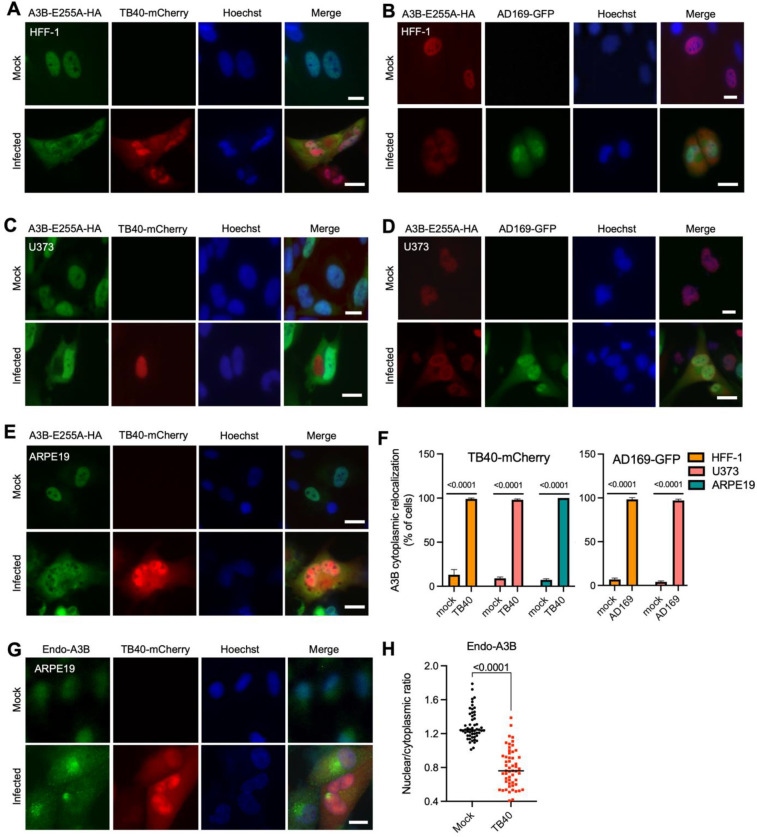
Fig. 2. Catalytic mutant and endogenous A3B are relocalized by HCMV.
(A-E) Representative IF microscopy images of the indicated cell types stably expressing A3B-E255A-HA incubated with medium alone (mock) or infected with the indicated HCVM strains for 72 hrs (10 μm scale).
(F) Quantification A3B-E255A-HA subcellular localization phenotypes shown in panels A-E. Each histogram bar reports the percentage of cells with cytoplasmic A3B-HA (n>100 cells per condition; mean +/− SD with indicated p-values from unpaired student’s t-tests).
(G) Representative IF microscopy images of ARPE19 cells incubated with medium alone (mock) or infected with TB40-mCherry for 72 hrs, stained for endogenous A3B (10 μm scale).
(H) Quantification of endogenous A3B subcellular localization phenotype shown in panel G. The dot-plot chart shows the ratio between nuclear and cytoplasmic fluorescence intensity (n>50 cells per condition; p-values were obtained using unpaired student’s t-tests).

