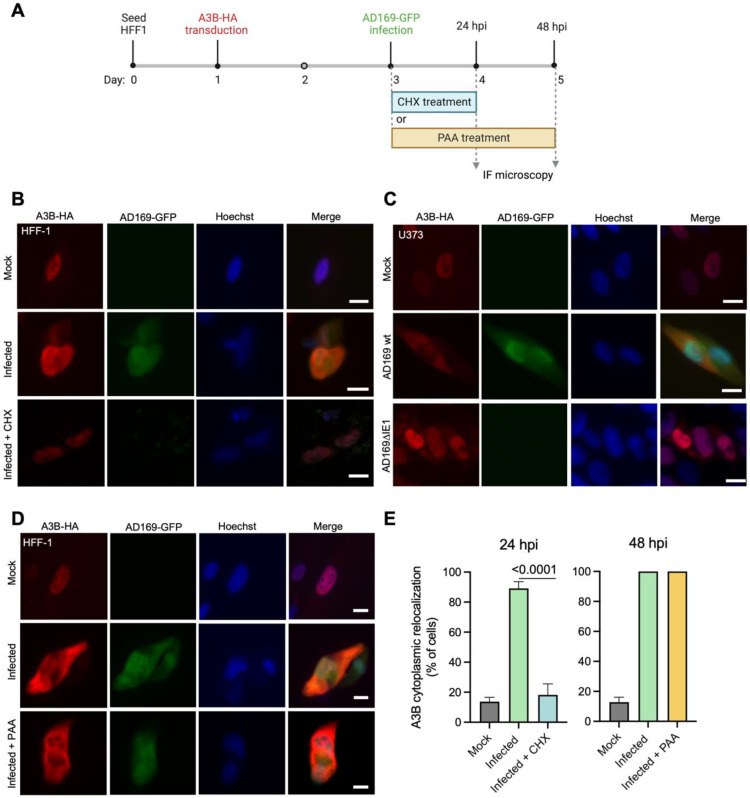
Fig. 6. A3B relocalization requires de novo translation of HCMV proteins but it does not require viral DNA synthesis.
(A) Schematic representation of cycloheximide (CHX) and phosphonoacetic acid (PAA) treatment in infected cells. Image created with BioRender.
(B) Representative IF microscopy images of HFF-1 cells stably expressing A3B-HA incubated with medium alone (mock) infected with AD169-GFP and treated with DMSO or CHX for 24 hrs (10 μm scale).
(C) Representative IF microscopy images of HFF-1 cells stably expressing A3B-HA incubated with medium alone (mock) infected with AD169-GFP, or AD169-GFP ΔIE1 for 72 hrs (10 μm scale).
(D) Representative IF microscopy images of HFF-1 cells stably expressing A3B-HA incubated with medium alone (mock) or infected with AD169-GFP and treated with DMSO or PAA for 48 hrs (10 μm scale).
(E) Quantification A3B-HA subcellular localization phenotypes shown in panels B and D. Each histogram bar reports the percentage of cells with cytoplasmic A3B-HA (n>80 cells per condition; mean +/− SD with indicated p-values from unpaired student’s t-tests).

