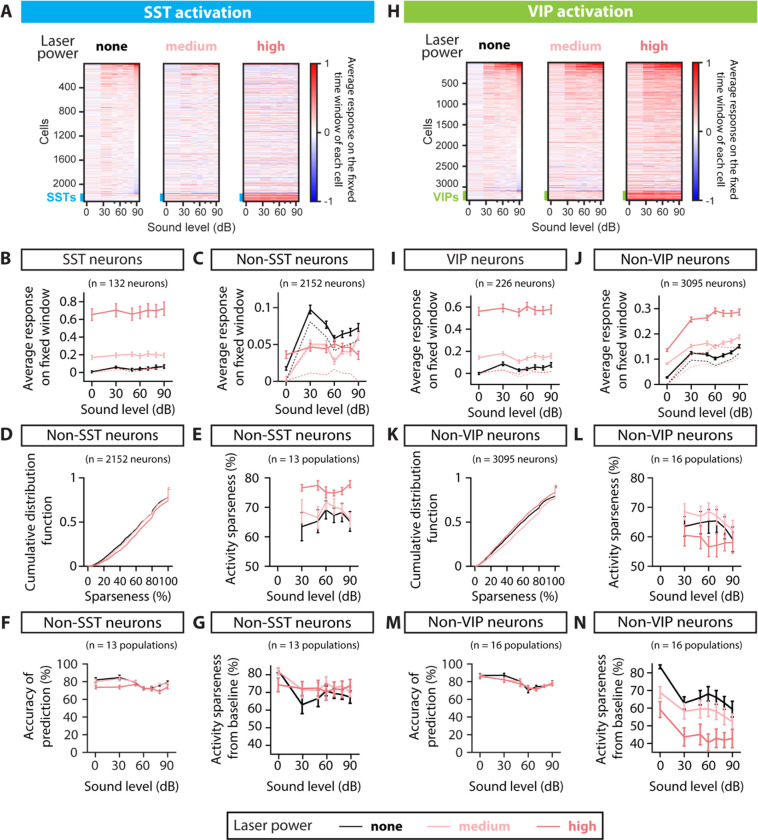
FIGURE 2: POPULATION RESPONSE TO SST AND VIP NEURONAL ACTIVATION AND SPARSENESS.
A. Rasters of the average fluorescence versus sound pressure level for all neurons imaged in the SST-Cre mice, calculated over the 1-s fixed time window (see Methods). Rasters from left to right correspond to SST neuronal activation with no laser power, medium laser power and high laser power. The thick blue line at the bottom of each raster indicates the SST interneurons. Cells are ordered given their response at 90dB and no laser power. B. Absolute average fluorescence (solid lines) and change in average fluorescence relative to the laser and silence condition (dashed lines) over a 1-s fixed window as a function of sound pressure level for the whole population of SST neurons recorded (132 neurons), when the SST neurons are activated. The solid and dashed black line nearly overlap. C. Absolute average fluorescence (solid lines) and change in average fluorescence relative to the laser and silence condition (dashed lines) over a 1-s fixed window as a function of sound pressure level for the whole population of non-SST neurons recorded (2152 neurons), when the SST neurons are activated. D. Cumulative distribution function of sparseness normalized on the population of non-SST neurons, when the SST neurons are activated. Sparseness was defined for non-SST neurons with an increase in response to sound compared to silence at a given laser, corresponding to 2033, 2029 and 1994 neurons for no, mid and high laser, respectively. E. Average activity sparseness measured from silence at a given laser power as a function of sound pressure level for each population of neurons (SST neurons excluded), when the SST neurons are activated. The points at 0dB were by design 100% and thus omitted from the plot and the statistical test. F. Decoding accuracy of SVM decoder at each laser power, decoding individual sound pressure levels using non-SST neuronal responses within 1-s fixed window, when the laser illuminates AC and stimulates SST neurons. G. Average activity sparseness measured baseline as a function of sound pressure level for each population of neurons (SST neurons excluded), when the SST neurons are activated. There was a significant interaction between sound and laser amplitude, but no significant sound-independent laser effect in the activity sparseness measured from baseline upon SST activation (, GLME). H. Rasters of the average fluorescence versus the sound pressure level for all neurons imaged in the VIP-Cre mice, calculated over the 1-s fixed time window (see Methods). Rasters from left to right correspond to VIP activation with no laser power, medium laser power and high laser power. The thick green line at the bottom of each raster indicates the VIP interneurons. Cells are ordered given their response at 90dB and no laser power. I. Absolute average fluorescence (solid lines) and change in average fluorescence relative to the laser and silence condition (dashed lines) over a 1-s fixed window as a function of sound pressure level for the whole population of VIP neurons recorded (226 neurons), when the VIP neurons are activated. The solid and dashed black line nearly overlap. J. Absolute average fluorescence (solid lines) and change in average fluorescence relative to the laser and silence condition (dashed lines) over a 1-s fixed window as a function of sound pressure level for the whole population of non-VIP neurons recorded (3095 neurons), when the VIP neurons are activated. K. Cumulative distribution function of sparseness normalized on the population of non-VIP neurons, when the VIP neurons are activated. Sparseness was defined for non-VIP neurons with an increase in response to sound compared to silence at a given laser, corresponding to 2979, 2921 and 3020 neurons for no, mid and high laser, respectively. L. Average activity sparseness measured from silence at a given laser power as a function of sound pressure level for each population of neurons (VIP neurons excluded) when the VIP neurons are activated. The points at 0dB were by design 100% and thus omitted from the plot and the statistical test. M. Decoding accuracy of SVM decoder at each laser power, decoding individual sound pressure levels using non-VIP neuronal responses within 1-s fixed window, when the laser illuminates AC and stimulates VIP neurons. N. Average activity sparseness measured from baseline as a function of sound pressure level for each population of neurons (VIP neurons excluded), when the VIP neurons are activated. There was a significant decrease in activity sparseness measured from baseline upon VIP activation , GLME). For all panels, black, pink and red colors correspond to no laser power (0 mW/mm2), medium laser power (~0.3 mW/mm2) and high laser power (~3.5 mW/mm2), respectively (see Methods for power calibration).

