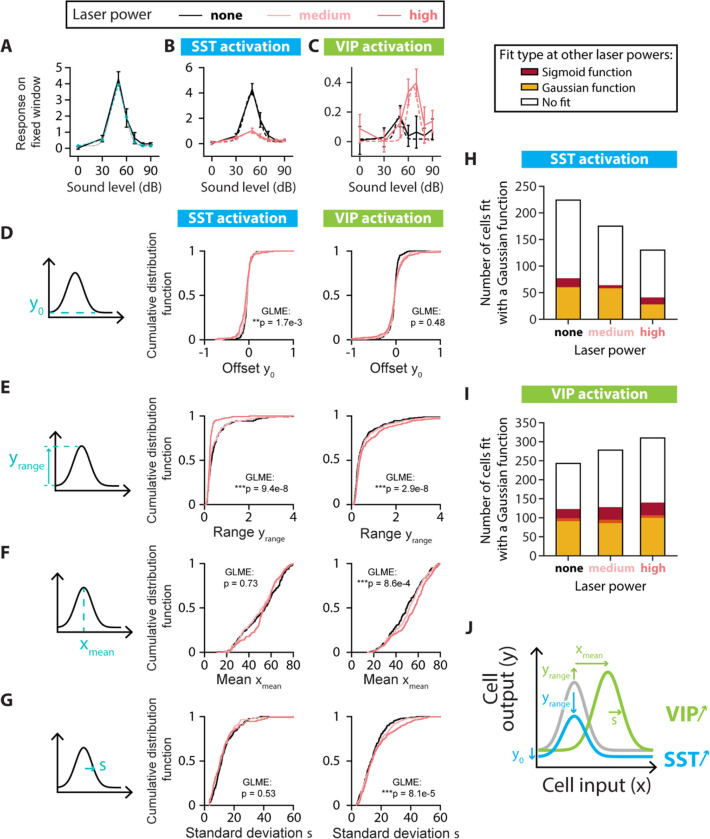
FIGURE 5: SINGLE-CELL FITS OF RESPONSE-LEVEL CURVES FOR NONMONOTONIC CELLS.
A. Example neuron with a nonmonotonic response-level curve (solid black line) with a Gaussian fit estimated at the probed sound pressure levels (blue dashed line with circles) and the Gaussian function with the same parameters (dotted black line). The parameters for the Gaussian fit are: Offset amplitude ; Range ; Mean ; Standard Deviation . B. Example of changes to the response-level curve of a sound-increasing nonmonotonic neuron upon SST neuronal activation. Response-level curves (solid lines) are fit by Gaussian functions (dotted lines) at no (black lines) and high (red lines) laser powers of SST neuronal activation. The parameters for the Gaussian fit are, for no SST neuronal activation: dB; and for SST neuronal activation: . C. Example of changes to the response-level curve of a sound-increasing nonmonotonic neuron upon VIP neuronal activation. Response-level curves (solid lines) are fit by Gaussian functions (dotted lines) at no (black lines) and high (red lines) laser powers of VIP neuronal activation. The parameters for the Gaussian fit are, for no VIP neuronal activation: .. D. Schematic showing the offset amplitude parameter of the Gaussian fit (left panel) and cumulative distribution function of for nonmonotonic sound-increasing neurons at different laser powers of SST (middle panel) and VIP (right panel) neuronal activation. E. Schematic showing the amplitude range parameter of the Gaussian fit (left panel) and cumulative distribution function of for nonmonotonic sound-increasing neurons at different laser powers of SST (middle panel) and VIP (right panel) neuronal activation. F. Schematic showing the mean parameter of the Gaussian fit (left panel) and cumulative distribution function of for nonmonotonic sound-increasing neurons at different laser powers of SST (middle panel) and VIP (right panel) neuronal activation. G. Schematic showing the standard deviation parameter of the Gaussian fit (left panel) and cumulative distribution function of for nonmonotonic sound-increasing neurons at different laser powers of SST (middle panel) and VIP (right panel) neuronal activation. H. Fit types (sigmoid in red, Gaussian in yellow, no fit in white) at one or both of the other laser powers for the non-SST neurons fit by a Gaussian function at no, medium and high laser powers of SST neuronal activation. The overlap between yellow and red (orange) indicates neurons fit by a sigmoid function at one laser power and a Gaussian function at the other laser power. I. Fit types (sigmoid in red, Gaussian in yellow, no fit in white) at one or both of the other laser powers for the non-VIP neurons fit by a Gaussian function at no, medium and high laser powers of VIP neuronal activation. The overlap between yellow and red (orange) indicates neurons fit by a sigmoid function at one laser power and a Gaussian function at the other laser power. J. Schematic of the mean significant changes to the response-level curve of a nonmonotonic sound-increasing cell (gray line) upon SST (blue line) and VIP (green line) neuronal activation. For all panels, black, pink and red colors correspond to no laser power (0 mW/mm2), medium laser power (~0.3 mW/mm2) and high laser power (~3.5 mW/mm2), respectively (see Methods for power calibration). For all panels, the statistical test GLME was performed on the distributions at the three different levels of interneuron activation, with n.s. corresponding to non-significant, * corresponds to p<0.05, ** corresponds to p<0.01, *** corresponds to p<0.001. There are n=224, n=175 and n=130 sound-increasing nonmonotonic cells fit at no, medium and high laser powers of SST neuronal activation, respectively. There are n=243, n=278 and n=310 sound-increasing nonmonotonic cells fit at no, medium and high laser powers of VIP neuronal activation, respectively.

