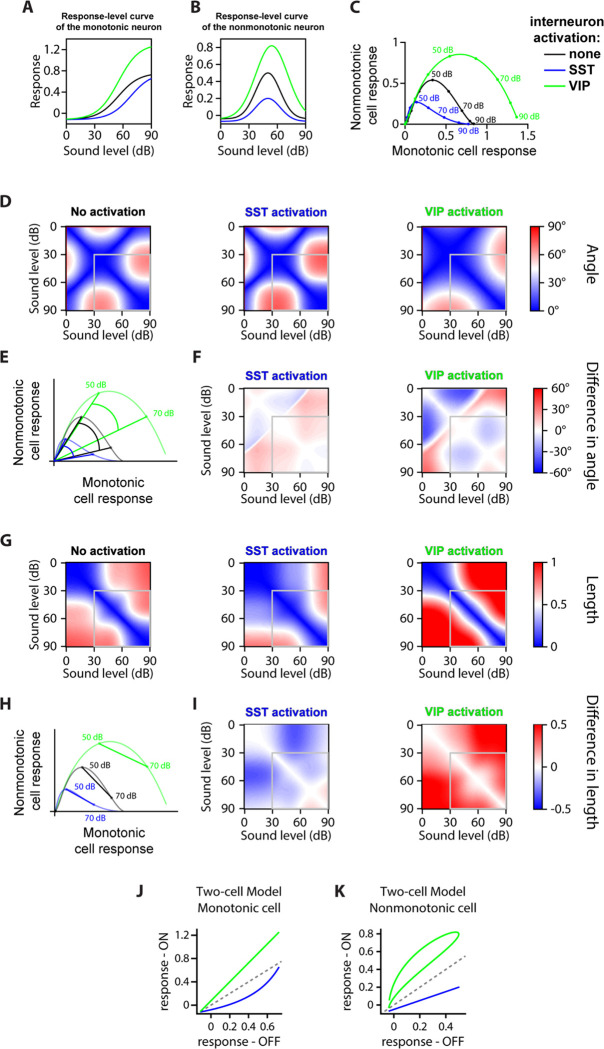
FIGURE 6: TWO-CELL MODEL.
A. Response-level curve of the monotonic cell with parameters taken as the mean parameters from Figure 4 at no and high laser power. The parameters for the sigmoid curve with no interneuron activation (black) are: Offset amplitude ; Range ; Midpoint ; Width . Upon SST neuronal activation (blue), all parameters remain constant except for: Midpoint ; Upon VIP neuronal activation (green), all parameters remain constant except for: Range .. B. Response-level curve of the nonmonotonic cell with parameters taken as the mean parameters from Figure 5 at no and high laser power. The parameters for the Gaussian curve with no interneuron activation (black) are: Offset amplitude ; Range Mean ; Standard Deviation . Upon SST neuronal activation (blue), all parameters remain constant except for: Offset amplitude ; Range ; Upon VIP neuronal activation (green), the offset amplitude remains constant, and: Range ; Mean ; Standard Deviation .C. Trajectory of the population’s response from 0 dB to 90 dB in the neural space, with the response of the monotonic cell on the x-axis and the response of the nonmonotonic cell on the y-axis. The response of both cells at 0dB has been subtracted from the curves, thus the dots at the (0,0) coordinate are the response to 0dB, and the end of the curves on the right indicate the response to 90dB. The trajectories are computed from 0 dB to 90dB with 1dB increments, and circles on a line represent 10dB increments from 0dB to 90dB. D. Confusion matrix of the separation angle between population responses to each sound and laser power from silence at a given laser power, for no (left), SST (middle) and VIP (right) neuronal activation. Sound pressure level is in 1dB increments, and the gray box indicates the sound levels sampled in the experiments (Figure 3D, and G) E. Schematic in the neural space (see panel C) of the angle between 50 dB and 70dB when there is no (black), SST (blue) or VIP (green) neuronal activation, starting from the population’s response to silence for each case of (or lack of) interneuron activation. The angle is greatest when SST neurons are activated, and smallest when VIP neurons are activated. F. Confusion matrix of the difference in separation angle from SST (left) or VIP (right) neuronal activation to no interneuron activation, with the angles calculated as in (D). Sound level is in 1dB increments, and the gray box indicates the sound pressure levels sampled in the experiments (Figure 3F and I). The mean angle difference for SST neuronal activation is, over 1–90dB: + 3.6° and over 30–90dB: + 3.7°; for VIP activation, over 1–90dB: − 4.0°, and over 30–90dB: − 4.1°. G. Confusion matrix of the length of the population vector between each sound pressure level at a given laser power, for no (left), SST (middle) and VIP (right) neuronal activation. Sound pressure level is in 1dB increments, and the gray box indicates the sound pressure levels sampled in the experiments (Figure 3J and M). H. Schematic in the neural space (see panel C) of the vector length between 50 dB and 70dB when there is no (black), SST (blue) or VIP (green) neuronal activation. The vector length is greatest when VIP neurons are activated, and smallest when SST neurons are activated. I. Confusion matrix of the difference in vector length from SST (left) or VIP (right) neuronal activation to no interneuron activation, with the lengths calculated as in (G). Sound pressure level is in 1dB increments, and the gray box indicates the sound pressure levels sampled in the experiments (Figure 3I and L). The mean length difference for SST neuronal activation is, over 1–90dB: − 0.12 a.u. and over 30–90dB: − 0.07 a.u.; for VIP neuronal activation, over 1–90dB, + 0.27 a.u. and over 30–90dB: + 0.21 a.u. J. Response of the monotonic cell with laser activation versus no laser activation. SST neuronal activation shows a divisive regime, a subtractive regime, a combination of divisive and subtractive or multiplicative and subtractive regimes depending on the range of responses sampled. VIP neuronal activation shows a multiplicative regime or an additive and multiplicative regime depending on the range of responses sampled. K. Response of the nonmonotonic cell with laser activation versus no laser activation. SST neuronal activation shows a combination of divisive and subtractive regime. VIP neuronal activation shows a multiplicative regime, and additive regime or an additive and multiplicative regime depending on the range of responses sampled. For all panels, black indicates no interneuron activation, blue indicates SST neuronal activation and green indicates VIP neuronal activation.

