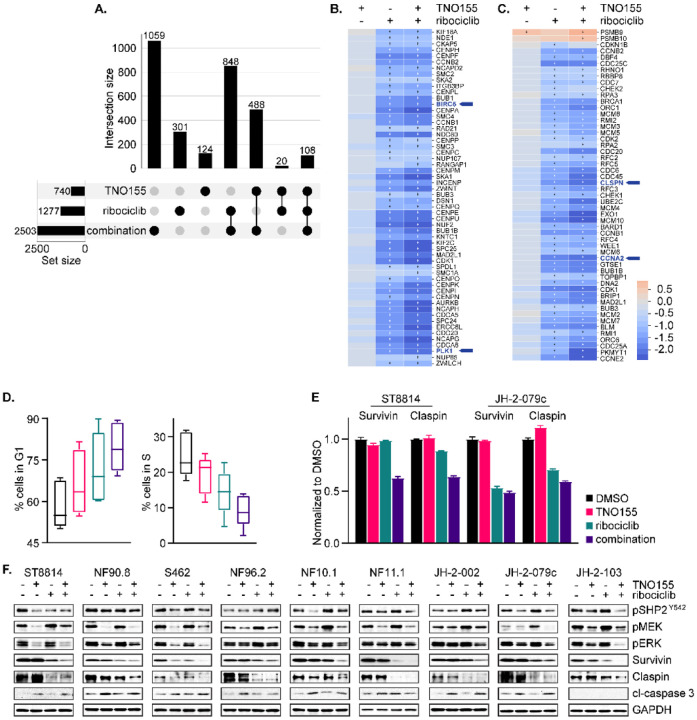
Fig. 6. Combination of TNO155 and ribociclib additively inhibits cell cycle and induces apoptosis.
(A) Upset matrix plot derived from RNAseq analysis, showing the overlapping numbers of significant genes (P adj< 0.05 and |FC|> 1.5) after 24-hour treatment with 0.3 μmol/L TNO155, 1 μmol/L ribociclib and their combination, normalized to DMSO control. (Rows=the sets; Columns=intersections between these sets). (B and C) Heatmaps demonstrating the more potent transcriptional inhibition of mitotic prometaphase (B) and cell cycle checkpoints (C) by combined TNO155+ribociclib relative to either single agent alone, highlighting BIRC5, PLK1, CLSPN and CCNA2. + = significance. (D) Five NF1-MPNST cell lines were treated with DMSO, 0.3 μmol/L TNO155 and/or 1 μmol/L ribociclib for 48 hours, following overnight starvation in 0.1% FBS-containing culture medium to synchronize cells. Cells were fixed in ice cold 70% ethanol and stained with propidium iodide/ RNase staining solution (Cell Signaling Technology, #4087), and then analyzed by flow cytometry. (E) ST8814 and JH-2–079c were treated with DMSO, 0.3 μmol/L TNO155 and/or 1 μmol/L ribociclib for 48 hours, and then protein lysates were assessed using human apoptosis antibody array (R&D systems, #ARY009). Signal intensity from technical duplicates was quantified by densitometry analysis using image J and normalized to DMSO. Data represent mean ± SEM. (F) Nine NF1-MPNST cell lines were treated as in E. and the indicated proteins involved in apoptosis and ERK signaling were detected using immunoblot.

