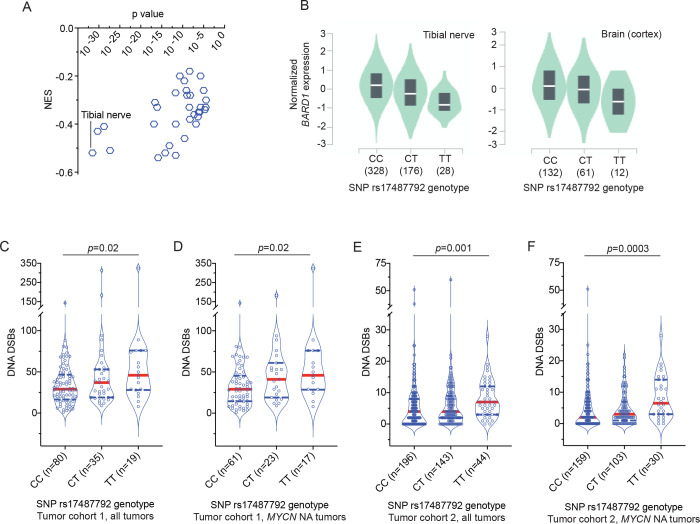
Figure 1. Common BARD1 germline risk variants correlate with decreased BARD1 expression and genome-wide deficiencies in DNA repair.
(A) Plot of the normalized effect size (NES) of the SNP rs17487792 eQTL versus p value for 33 human tissues derived from the GTEx project.
(B) Plots of BARD1 expression versus SNP rs17487792 genotype in tibial nerve (left) and brain cortex (right) derived from the GTEx project.
(C-F) Violin plots depicting the number of DNA DSBs in neuroblastoma tumors from patients with different germline SNP rs174877792 genotypes. Panels C and D depict quantity of DNA DSBs in cohort 1 among all tumors or among only tumors without MYCN amplification, respectively. Panels E and F depict quantity of DNA DSBs in cohort 2 among all tumors or among only tumors without MYCN amplification, respectively. Red dotted line denotes median and blue dotted lines denotes quartiles.
MYCN NA, MYCN non-amplified.

