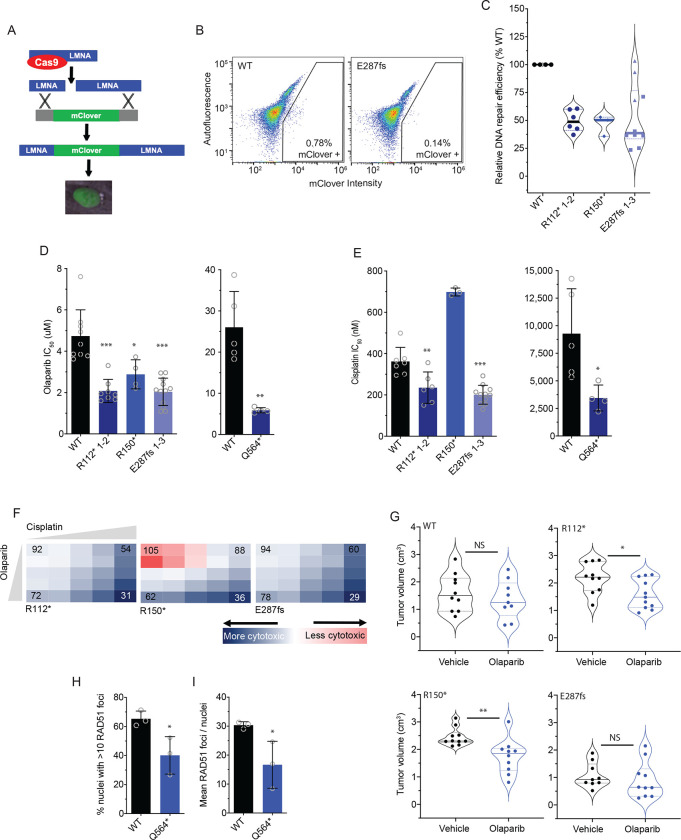
Figure 4. BARD1+/mut cells are deficient in DNA repair and sensitive to PARP inhibition.
(A) Schematic of the mClover-LMNA HDR assay.39
(B) Representative flow cytometry plots of IMR-5 WT and BARD1+/E287fs cells co-transfected with pX330-LMNA1 gRNA and pCR2.1-CloverLamin repair template plasmids with gating strategy for clover-positive cells indicated.
(C) Violin plots showing relative DNA damage repair efficiency across IMR-5 BARD1+/mut cells as quantified with the mClover-LMNA HDR assay shown in A and B.
(D) Olaparib IC50 values in IMR-5 WT and BARD1+/mut cell lines (left) and in RPE1 WT and BARD1+/mut cell lines (right).
(E) Cisplatin IC50 values in IMR-5 WT and BARD1+/mut cell lines (left) and in RPE1 WT and BARD1+/mut cell lines (right).
(F) Relative cytotoxicity of combined olaparib and cisplatin in IMR-5 BARD1+/mut cell lines compared to WT. Each square represents a single dose combination. Blue squares represent drug combinations at which greater cytotoxicity is observed in BARD1+/mut cells; red squares represent drug combinations at which greater cytotoxicity is observed in WT cells. Numbers in corner cells represent the percent of isogenic cells alive compared to WT cells alive at equivalent doses.
(G) Violin plots of tumor volumes after 2 weeks of olaparib treatment in BARD1+/mut versus WT IMR-5 xenografts. (n=9–11 mice/cohort). Tumor volumes for olaparib-treated BARD1 E287fs xenografts measured on day 13. Solid lines denote medians and dotted lines denote quartiles.
(H) Proportion of RPE1 WT and RPE1+/Q564* nuclei with >10 RAD51 foci after treatment with cisplatin.
(I) Mean RAD51 foci per RPE1 WT and RPE1+/Q564* nucleus after treatment with cisplatin.
Data in C-E are means ± SD of 3–12 biological replicates of each isogenic cell line, including multiple cell lines with identical BARD1 variants (n = 2 IMR-5 BARD1+/R112*, n = 1 for IMR-5 BARD1+/R150* and n = 3 for IMR-5 BARD1+/E287fs cell lines). LMNA, lamin A/C; *p < 0.05, **p < 0.01, ***p < 0.0001; NS, not significant as measured by T test.

