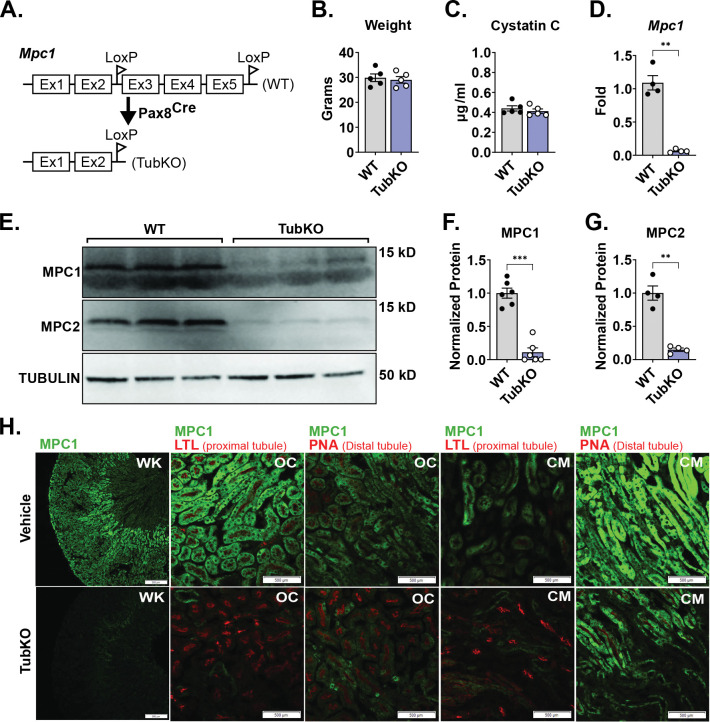
FIGURE 2. Generation and basic characterization of MPC TubKO mice.
(A) Schematic illustrating the generation of tubular Mpc1 null allele, MPC TubKO mice (TubKO). (B-C) Bar graphs showing body weights (B) and serum cystatin C concentration (C) in WT and MPC TubKO mice. (n = 5/group, 8-week-old mice).
(D) Bar graph comparing mouse kidney Mpc1 mRNA levels in WT and MPC TubKO mice. (n = 4/group, 7 – 12-week-old mice, ** p < 0.01 by unpaired t test with Welch’s correction).
(E-G) Representative Western blot of kidney MPC1 and MPC2 protein abundance (E) and quantification of normalized MPC1 (F) and MPC2 (G) levels in WT and MPC TubKO mice. Tubulin was blotted as loading control and used as the protein quantification normalizer. (n = 4 – 6/group, 7 – 12-week-old mice, *** p < 0.001 and ** p < 0.01 by by unpaired t test with Welch’s correction).
(H) Representative immunostaining images of kidney MPC1 (green) and lotus tetragonolobus lectin (LTL, green, proximal tubule marker) or peanut agglutinin (PNA, green, distal tubule marker) in whole kidney (WK), outer-cortex (OC), and cortico-medullary junction (CM) in WT and MPC TubKO mice. (Images taken at 4x (WK) or 20x (OC and CM) magnification, scale bar = 500 μm).
Data are presented as means ± SEM.

