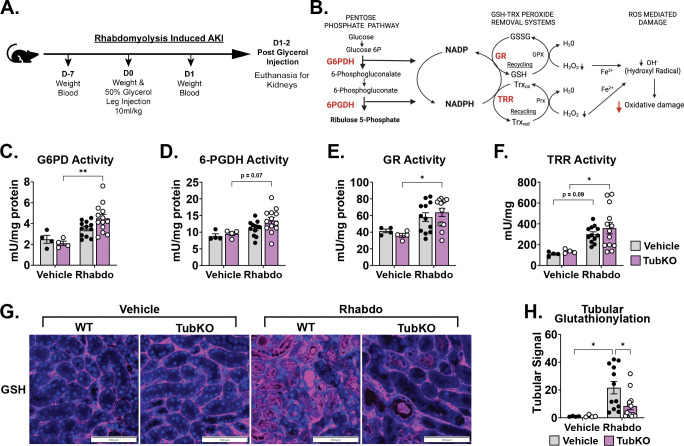
FIGURE 6. Downregulation of tubular Mpc1 is an early adaptive response to protect from oxidative damage.
(A-B) Schematics illustrating the time course of the rhabdomyolysis-induced AKI model (A) and the interconnectedness of the pentose pathway and cellular antioxidant defense systems (B).
(C-F) Bar graphs showing kidney enzyme activities following vehicle treatment or rhabdomyolysis (Rhabdo)-induced AKI. Glucose-6-phosphate dehydrogenase (C, G6PD), 6-phosphogluconate dehydrogenase (D, 6PGDH), glutathione reductase (E, GR), and thioredoxin reductase (F, TRR). (n = 4/group for vehicle treatment, n = 12 – 13/group for Rhabdo, 8 – 12-week-old mice, * p < 0.05 and ** p < 0.01 by two-way ANOVA with Tukey’s multiple comparison test).
(F) Representative immunostaining images of kidney protein-glutathionylation (pink) and Dapi (blue) following vehicle treatment or rhabdomyolysis-induced AKI in WT and MPC TubKO mice. (Scale bar = 100 μm, n = 4/group for vehicle treatment, n = 12 – 13/group for Rhabdo, 8 – 12-week-old mice).
(G) Bar graph showing quantified kidney protein-glutathionylation following vehicle treatment or rhabdomyolysis-induced AKI in WT and MPC TubKO mice. (n = 4/group for vehicle treatment, n = 12 – 13/group for Rhabdo, 8 – 12-week-old mice, * p < 0.05 by two-way ANOVA with Tukey’s multiple comparison test).
Data presented as means ± SEM

