
Figure 1:
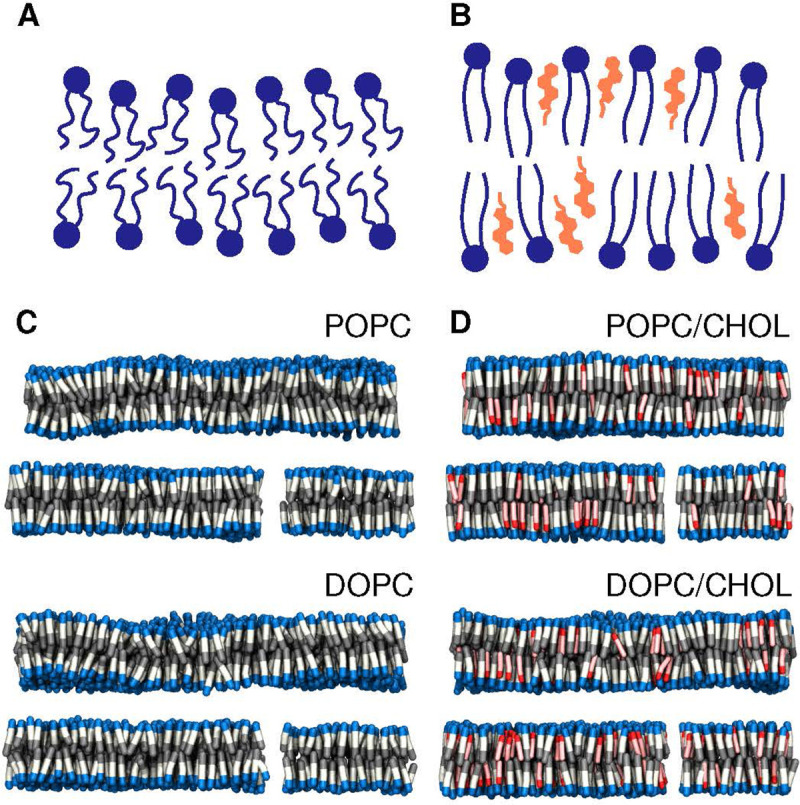
Cholesterol enriched bilayers. (A, B) Schematic of the effect of cholesterol on lipid membrane order. (C) Snapshots from all-atom simulations of pure-POPC and pure-DOPC bilayers at rest; lipid molecules are visualized as blue/white/gray rods. The water buffer is omitted for clarity. (D) Simulation snapshots of POPC/CHOL and DOPC/CHOL bilayers. Cholesterol molecules are represented as red/pink rods.