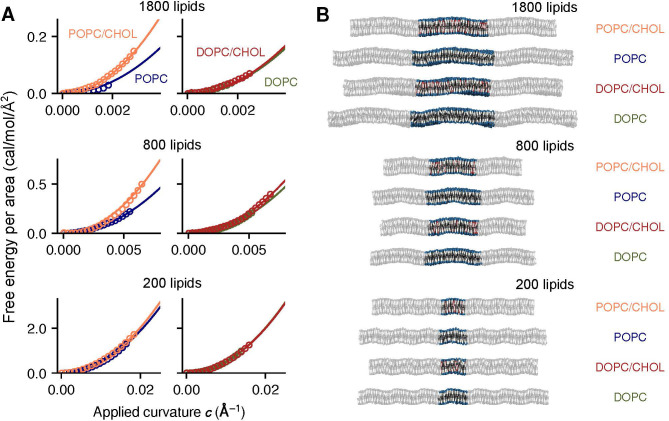
Figure 2:
Direct calculation of the free-energy cost of lipid bilayer bending using the Multi-Map enhanced-sampling simulation method. (A) Potentials-of-mean-force (PMFs) as a function of bilayer curvature for an applied sinusoidal shape along the x-axis. Data are shown for POPC (blue), POPC/CHOL (orange), DOPC (green) and DOPC/CHOL (red) bilayers, containing either 1800, 800 or 200 lipid molecules (as indicated). All PMF profiles are given in units of free-energy per area; symbols indicate computed values, and solid lines are quadratic fits. (B) Representative snapshots of each bilayer, represented as in Fig. 1. The figure highlights the periodic unit cell, flanked by its images along the direction of the sinusoid.

