
Figure 7:
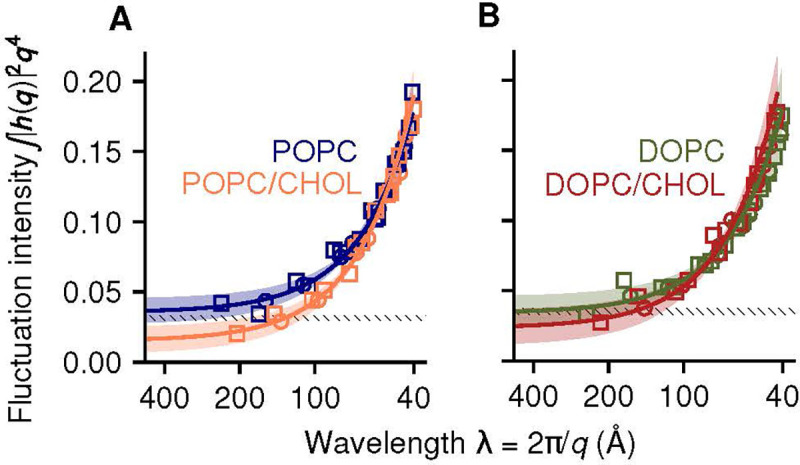
Spectral analysis of bending fluctuations of bilayers at rest, based on conventional MD simulations. (A) POPC and POPC/CHOL bilayers (∗∗P = 0.002). (B) DOPC and DOPC/CHOL bilayers (P = 0.24). Solid lines are best fits of the function in Eq. 5, with shaded bands indicating the 95% confidence interval (CI). P-values are for comparisons of with and without cholesterol. For comparison, dashed bands show the 95% CI for POPC and DOPC under the q−4 long-wavelength Helfrich-Canham theory [37, 38], using published values of [26].