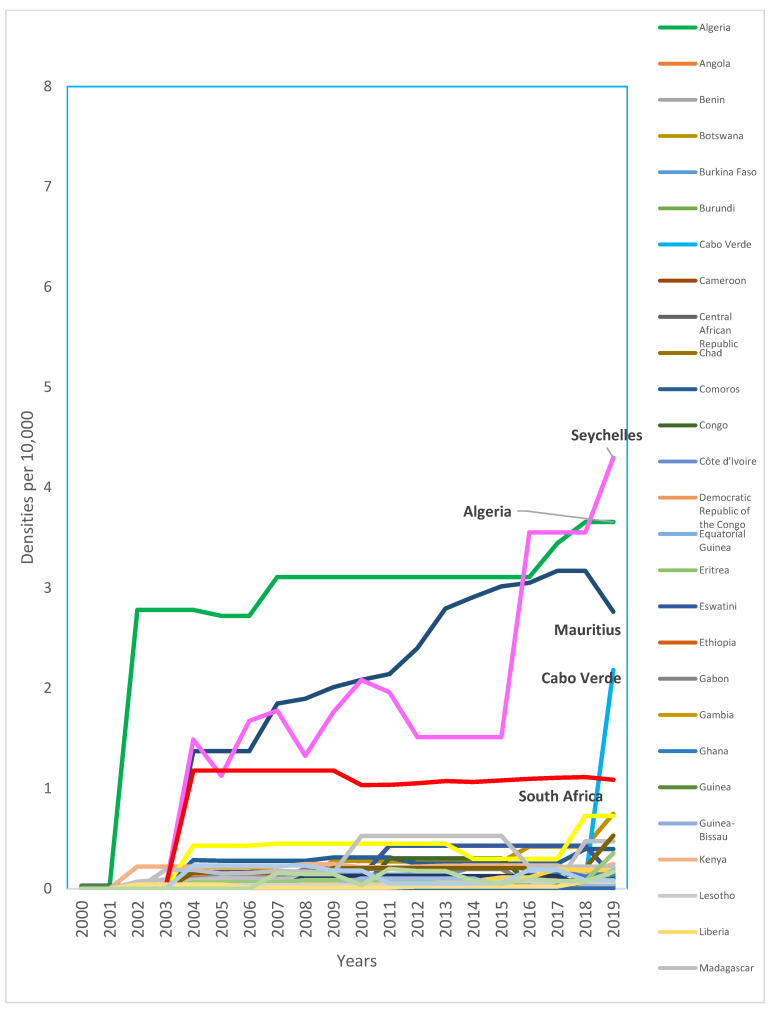
Figure 1.
Trends in density of dentists per 10,000 population for the AFR, 2000-2019 (Appendix D). Source: The workforce data are based on the latest available data in the NHWA data platform as of 31 March 2021, apart from the data for 2019, which used a combination of the latest available data from the NHWA data platform and King’s College London survey. Countries with the highest densities were named in the plot and highlighted in bold.

