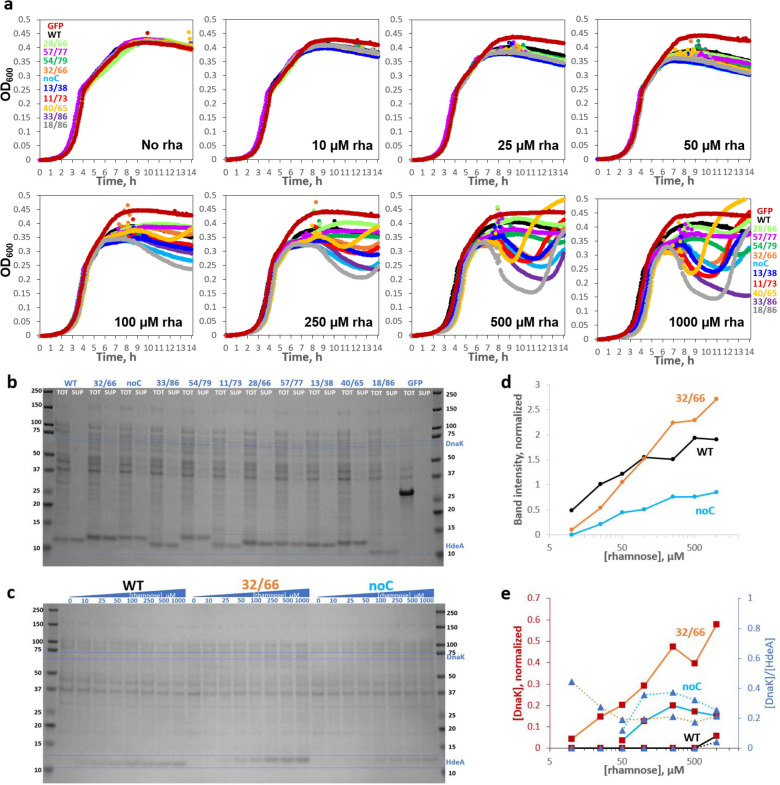
Figure 2: HdeA variants exhibit varying levels of toxicity characterized by DnaK overexpression and cell lysis.
(a) Growth curves of HdeA variants in standard LB broth with varying [inducer], measured in parallel in the same 96-well plate, with all wells for each variant started from the same inoculum, showed variant- and [inducer]-dependent drops in OD600. WT HdeA and sGFP did not. (b) Non-reducing SDS-PAGE of end-point samples from 2500 μM rhamnose cultures showed clear expression of all constructs, albeit weaker than sGFP. Variants with more sequence-distal Cys pairs migrated lower on the gel, consistent with greater compaction of the unfolded state by longer-range disulfides (see Figure SI 6); note rightward skew of the gel. Juxtaposing identical volumes of centrifuged cell culture supernatant (“SUP”) and total culture (“TOT”) samples showed 86±11% (mean±S.D.) of HdeA in SUP across variants. All mutants showed many cytoplasmic protein bands in SUP, indicating cell lysis, and DnaK overexpression (confirmed by MS/MS). DnaK’s prominence in SUP indicated that it did not prevent lysis. (c) Non-reducing SDS-PAGE of the WT, 32/66, and noC constructs (TOT) as a function of [rhamnose]. (d) Quantitation of the HdeA bands in c, internally normalized to the abundant 37 kD band, showed a crossover between WT and 32/66 abundance. (e) Quantitation of the DnaK bands in panel c for 32/66 (orange line) and noC (light-blue line); observed [DnaK]/[HdeA] ratios converged to ~0.25.

