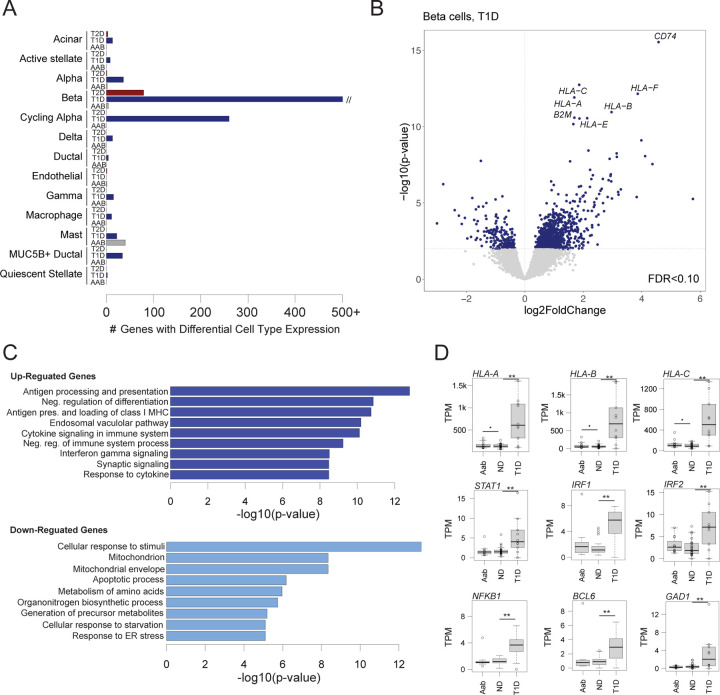
Figure 2. Changes in pancreatic islet cell type expression in disease states.
(A) Number of genes in each cell type with significant changes (FDR<.10) in expression in T1D, T2D, and T1D autoantibody positive (AAB) compared to non-diabetic (ND) donors using DESeq2. The x-axis is capped at 500 genes for legibility, although the number of genes significant in beta cells in T1D is much higher. (B) Differential gene expression in beta cells in T1D. Genes with up-regulated expression are on the right side of the dashed line, and genes with down-regulated expression are on the left side. The hard line represents the p-value threshold corresponding to FDR<.10. Genes with the most significant increase in expression are labelled. (C) Gene sets enriched among genes with up-regulated and down-regulated beta cell expression in T1D. (D) Normalized beta cell expression level of HLA class I and selected stress response genes across ND, AAB and T1D donors. **FDR<.10, *uncorrected p<.10

