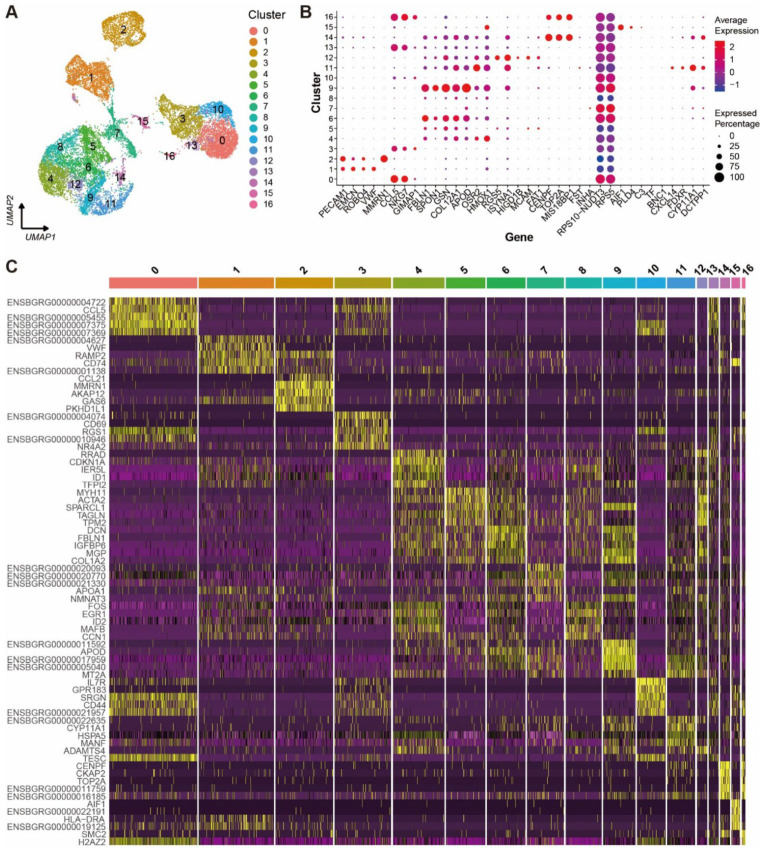
Figure 1.
Cell clusters and their signature gene features in yak ovary. (A) Uniform manifold approximation and projection (UMAP) scatterplot visualizing various cell clusters. Each point corresponds to a single-cell color-coded according to its cluster membership. (B) Dot plot showing expression features of the signature genes selected for each cell cluster among the cell clusters. Gene expression levels from low to high are indicated by a color gradient from blue to red. Percentages of cells expressing specific gene are indicated by size of dot. (C) Heat map exhibiting distinct expression patterning of the top five most variable genes for each cluster among the cell clusters. Gene expression levels from low to high are indicated by a color gradient from purple to yellow.

