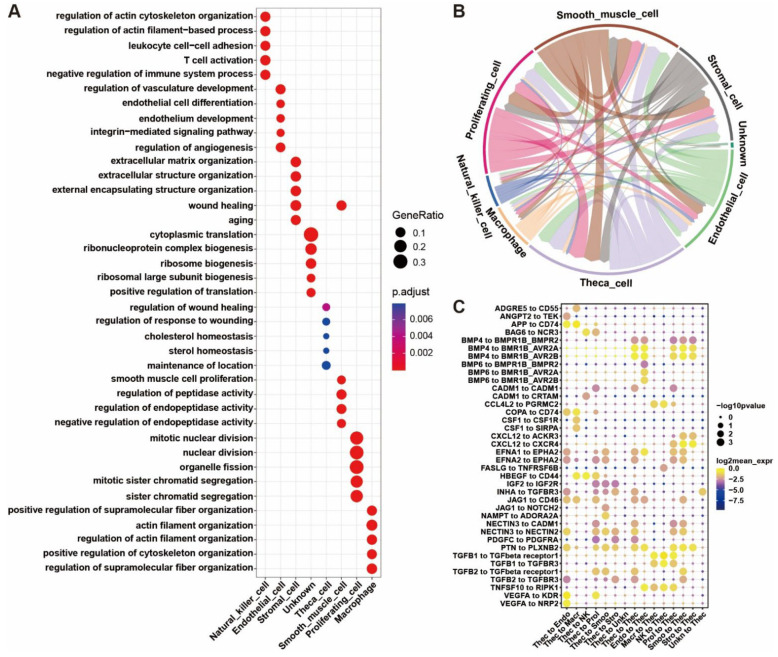
Figure 4.
Biological process enrichment for signature genes and cell-to-cell communication between yak ovarian cells. (A) Bubble plot showing the top five enriched biological process (BP) terms for each cell type from gene ontology (GO) analysis. Gene ratio in corresponding biological process is indicated by size of bubble. Adjusted p-values from low to high are indicated by a color gradient from red to blue. (B) Network exhibiting the cell-to-cell communication depending on significant ligand-receptor pairing interactions and the interaction directions. Arrows start from cell types expressing ligands and point to cell types expressing corresponding receptors. (C) Bubble plot demonstrating the ligand-receptor interactions via which the theca cells communicate with the other cell types. Endo, endothelial cell; Macr, macrophage; NK, natural killer cell; Prol, proliferating cell; Smoo, smooth muscle cell; Stro, stromal cell; Thec, theca cell; Unkn, unknown cell.

