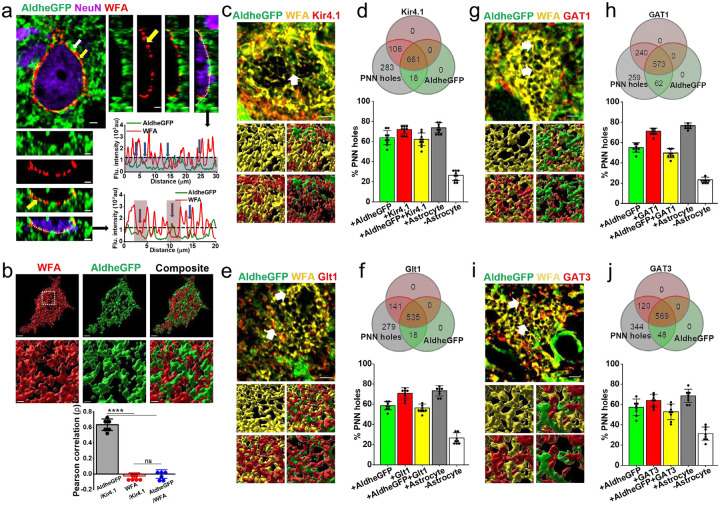
Fig. 1. Astrocytic processes and homeostatic proteins (Kir41. And GLT-1) are largely confined to PNN holes.
a Confocal micrograph showing WFA (red)-labelled PNN surrounded by AldheGFP (green) labelled astrocytic processes. White and yellow arrows point to astrocytic process on outer surface and within PNN holes respectively. The side and bottom panels show orthogonal planes of the 3D image. WFA and AldheGFP fluorescence intensities of a line drawn on the PNNs in orthogonal view planes showing PNN holes occupied by astrocytic processes (blue arrows). The blue area below the dotted line represents WFA threshold intensity. Vertical red bars in between two consecutive WFA peaks represent the area of PNN holes wherein astrocytic processes can be confined. Scale 2μm.
b 3D reconstruction of PV neuron surface area occupied by PNN (WFA - red) and astrocytic processes (AldheGFP - green) showing a non-overlapping interdigitating spatial interface. The marked area in the white square is magnified in the bottom panels. Scale bar 2μm on top and 1μm on bottom panels. Error bars show a highly positive Pearson correlation between astrocytic markers AldheGFP and Kir4.1 (0.63 ± 0.07) and a significantly negative correlation between PNN marker (WFA) and astrocytic markers Kir4.1 (−0.02 ± 0.04) and AldheGFP (−0.001 ± 0.05). n = 6PNNs/3m; ****P < 0.0001; one-way ANOVA, Tukey’s post-hoc test.
c Confocal micrograph (top) showing astrocytic processes (AldheGFP - green) expressing Kir4.1(red) in PNN (WFA - yellow) holes. Bottom panels show a 3D reconstruction of PNN holes (white arrows) occupied by astrocytic processes expressing Kir4.1.
d Venn diagram showing proportional occupancy of PNN holes by Kir4.1-expressing astrocytic processes. Bar diagram showing the percent of total PNN holes occupied by AldheGFP (63.83 ± 7.0), Kir4.1 (71.9 ± 4.22), both (62.13 ± 6.33), occupied by any astrocytic marker (73.64 ± 5.14), and not occupied by any astrocytic marker (26.35 ± 5.14). n = >40PNNs/10s/4m.
e Confocal micrograph (top) showing astrocytic processes (AldheGFP - green) expressing Glt1 (red) in PNN (WFA - yellow) holes. Bottom panels show 3D reconstruction of PNN holes (white arrows) occupied by astrocytic processes expressing Glt1.
f Venn diagram showing proportional occupancy of PNN holes by Glt1 expressing astrocytic processes. Bar diagram showing the percent of total PNN holes occupied by AldheGFP (58.68 ± 4.02), Glt1 (70.85 ± 5.55), both (56.35 ± 3.87), occupied by any astrocytic marker (73.37 ± 5.11), and not occupied by any astrocytic marker (26.62 ± 5.11). n = >40PNNs/8s/4m.
g Confocal micrograph (top) showing astrocytic processes expressing AldheGFP (green) and GAT1 (red) in PNN (WFA - yellow) holes. Bottom panels show 3D reconstruction of PNN holes occupied by astrocytic processes expressing GAT1 (red).
h Venn diagram showing proportional occupancy of PNN holes by GAT1 expressing astrocytic processes. Bar diagram showing the percent of total PNN holes occupied by AldheGFP (55.11 ± 4.59), GAT1 (71.06 ± 3.18), both (49.62 ± 4.56), occupied by any astrocytic marker (76.64 ± 2.57), and not occupied by any astrocytic marker (23.35 ± 2.57). n = >40PNNs/8s/4m.
i Confocal micrograph showing astrocytic processes expressing AldheGFP (green) and GAT3 (red) in PNN (WFA - yellow) holes. Bottom panels show 3D reconstruction of PNN holes occupied by astrocytic processes expressing GAT3.
j Venn diagram showing proportional occupancy of PNN holes by GAT3 expressing astrocytic processes. Bar diagram showing the percent of total PNN holes occupied by AldheGFP (57.41 ± 8.14), GAT3 (64.0 ± 6.18), both (52.95 ± 7.74), occupied by any astrocytic marker (68.62 ± 6.48), and not occupied by any astrocytic marker (31.37 ± 6.48). n = >40PNNs/8s/4m.
s and m represent the number of sections and mice respectively. Bar data are expressed as mean ± standard deviation (SD). Dots in the bars represent individual data points. Scale bar 2μm in top and 1μm in bottom images in c, e g, and i.

