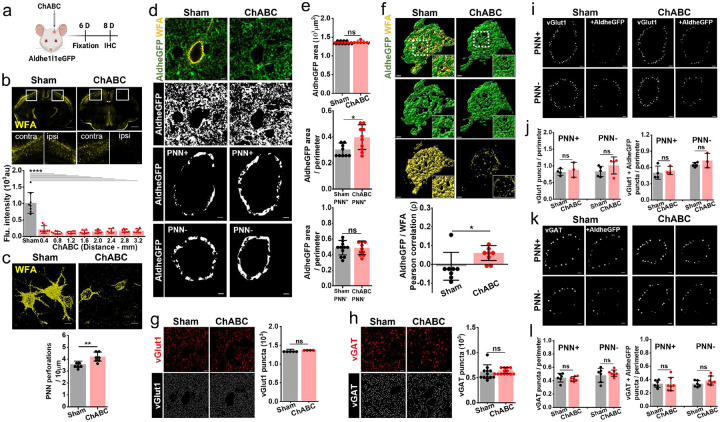
Fig. 4. PNN disruption increases pericellular astrocytic coverage without altering synaptic contacts.
a Schematics of intracranial ChABC injection and subsequent experiments.
b Confocal micrographs showing immunofluorescence of WFA (yellow) in sham and ChABC injected mouse brains. Marked rectangular areas in ipsilateral (right) and contralateral (left) hemispheres are magnified in bottom panels. Scale bars, 1mm in top and 100μm in bottom images. Bar diagram of fluorescence intensity of WFA in sham and ChABC-injected groups showing widespread PNN disruption throughout the cerebral cortex. (Sham: 1019.07 ± 318.16; ChABC: 0.4mm 209.38 ± 111.13, 0.8mm 112.95 ± 37.09, 1.2mm 121.11 ± 35.20, 1.6mm 137.94 ± 52.69, 2.0mm 147.37 ± 49.09, 2.4mm 170.54 ± 65.98, 2.8mm 168.53 ± 48.71, 3.2mm 168.05 ± 61.36), n = 8s/4m in sham, 8s/8m in ChABC.
c 3D volume images of PNNs (WFA - yellow) from sham with intact and dense PNNs compared to the ChABC injected mice showing disrupted PNNs with granulated and fragmented WFA labelling. Scale 10μm. Bar diagrams showing a significant increase in PNN perforation after ChABC-mediated PNN degradation (Sham 3.57 ± 0.25, n = 6s/4m; ChABC 4.19 ± 0.38, n = 8s/3m).
d Confocal micrographs showing AldheGFP (green) and WFA (yellow) fluorescence (top) and AldheGFP binarized signal of total area (2nd row from top), the pericellular area around PNN-expressing (3rd row from top) and non-expressing (bottom) neurons in sham (left panels) and ChABC-injected (right panels) groups.
e Bar diagram (top) of total AldheGFP area in a field of view of PNNs was unchanged in ChABC treated group (sham 1380.97 ± 23.04, n = 21i, 3m; ChABC 1393.50 ± 24.84, n = 20i, 3m). Bar diagram (middle) of normalized pericellular AldheGFP area increased significantly in PNN+ neurons in ChABC treated group (sham 0.30 ± 0.05, n = 48c/9s/7m; ChABC 0.39 ± 0.09, n = 38c/10s/7m) however remained unaltered in PNN− neurons in bottom bar diagram (sham 0.48 ± 0.09, n = 53c/11s/9m; ChABC 0.48 ± 0.86, n = 38c/10s/8m).
f 3D reconstruction of PNN (yellow) and pericellular astrocytic coverage (green) showing increased pericellular coverage and disintegrated PNN. Inset images represent the magnified areas marked by white squares. Bar data (bottom) show an altered spatial correlation between AldheGFP and WFA in ChABC treated condition (sham −0.01 ± 0.07; ChABC 0.06 ± 0.03, n = 8c/3s/3m in each group).
g Representative confocal images of vGlut1 fluorescence (top-red) and binary form of vGlut1 puncta (bottom-white) showing the unaltered numerical density of excitatory presynaptic puncta in ChABC treated condition (1368.63 ± 24.14, n = 55c/5s/5m) compared to sham (1374 ± 8.61, n = 21c/4s/4m).
h Representative confocal images of vGAT fluorescence (top-red) and binary form of vGAT puncta (bottom-white) showing the unaltered numerical density of inhibitory presynaptic puncta on PNN disruption in ChABC treated condition (643.95 ± 62.87, n = 51c/14s/7m) compared to sham (620.75 ± 138.95, n = 59c/13s/5m).
i Representative binary images from sham (left panels) and ChABC treated (right panels) groups showing pericellular vGlut1 puncta (left) and vGlut1 puncta with astrocytic contacts (right) in PNN expressing (top row) and PNN non-expressing (bottom row) cortical neurons.
j Bar graphs showing total pericellular vGlut1 puncta (left) and vGlut1 puncta with AldheGFP contacts (right) in sham and ChABC-treated groups. The numerical density of vGlut1 puncta remained unchanged in PNN-expressing neurons (sham 0.81 ± 0.09, n = 22c/4s/4m; ChABC 0.88 ± 0.02, n = 12c/3s/3m) as well as in PNN non-expressing neurons (sham 0.83 ± 0.15, n = 27c/5s/5m; ChABC 1.01 ± 0.22, n = 11c/4s/3m). Similarly, pericellular numerical density of vGlut1 puncta with astrocytic contacts(+AldheGFP) remained unchanged in PNN expressing neurons (sham 0.50 ± 0.12, n = 22c/4s/4m; ChABC 0.54 ± 0.07, n = 12c/3s/3m) as well as in PNN non expressing neurons (sham 0.65 ± 0.03, n = 27c/5s/5m; ChABC 0.72 ± 0.13, n = 11c/3s/3m).
k Representative binary images from sham (left panels) and ChABC treated (right panels) groups showing total pericellular vGAT puncta (left) and vGAT puncta with astrocytic contacts (right) in PNN expressing (top row) and PNN non-expressing (bottom row) cortical neurons.
l Bar graphs showing total pericellular vGAT puncta (left) and vGAT puncta with AldheGFP contacts (right) in sham and ChABC-treated groups. The numerical density of vGAT puncta remained unchanged in PNN-expressing neurons (sham 0.44 ± 0.6, n = 26c/6s/5m; ChABC 0.42 ± 0.03, n = 24c/7s/6m) as well as in PNN non-expressing neurons (sham 0.47 ± 0.10, n = 29c/6s/5m; ChABC 0.51 ± 0.04, n = 27c/7s/6m). Similarly, pericellular numerical density of vGAT puncta with astrocytic contacts(+AldheGFP) remained unchanged in PNN expressing neurons (sham 0.33 ± 0.05, n = 26c/6s/5m; ChABC 0.33 ± 0.10, n = 24c/7s/6m) as well as in PNN non expressing neurons (sham 0.33 ± 0.04, n = 29c/6s/5m; ChABC 0.38 ± 0.06, n = 27c/7s/6m).
c, s, and m indicate the number of cells, sections, and mice respectively. Bar graph data are expressed as mean±SD; dots on the bars represent the individual data points. *P < 0.05, ns = P > 0.05. unpaired two-tailed t-test with welch correction in c-I, One-way ANOVA, Tukey’s post-hoc test in b. Scale bar 5μm in field images in d, g, h; and 2μm in magnified images in d, f, i, and k.

