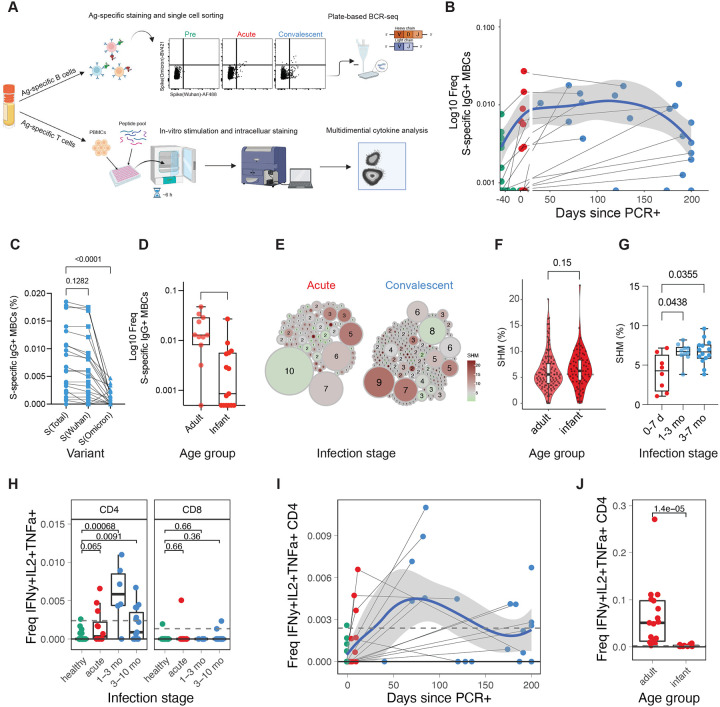
Figure 2. Transient memory B and T cell response to COVID-19 infection in infants and young children.
A) Diagram depicting the experiment (n infants and young children: pre=12, acute=12, conv=21; n adults: acute=17). B-G) Spike-specific B cells were sorted using FACS, and the BCR sequence of each clone was determined. B) Frequency of SARS-CoV-2 spike-specific IgG+ memory B cells as a proportion of CD20+ B cells. Samples of the same donor a connected by a gray line. Blue line indicates average values; shaded areas indicate 5th to 95th percentiles. C,D) Frequency of SARS-CoV-2 specific IgG+ memory B cells in C) infants and young children at convalescent phase and D) at acute phase in adults and infants and young children. E) Clonality analysis of sorted SARS-CoV-2 spike-specific IgG+ memory B cells in infants and young children (n = 220). Each clone is represented as a circle. Circle size indicates the number of IGHV sequences in each clone; color represents the mean IGHV somatic hypermutation rate. F) Somatic hypermutation rates of the IGHV genes in single sorted SARS-CoV-2 spike specific IgG+ memory B cells at acute phase. G) Mean somatic hypermutation rate of all cloned IGHV genes in indicated infant samples. H-J) T cells were stimulated with overlapping peptides against WT and Omicron variants. Cytokine production was determined via flow cytometry. H) Box plot showing the fraction of multifunctional T cells (IFNg+, IL-2+, TNFa+) at different infection stages. I) Kinetics of multifunctional CD4+ T cell response. J) Comparison of multifunctional CD4+ T cell response during the acute phase of infection in infants and young children and adults. Statistical comparisons were conducted with Wilcoxon rank sum test. Solid line indicates median healthy response; dashed line indicates 3x median healthy response.

