


Figure 2: Trends and levels of HIV in Malawi, 2010-2021.
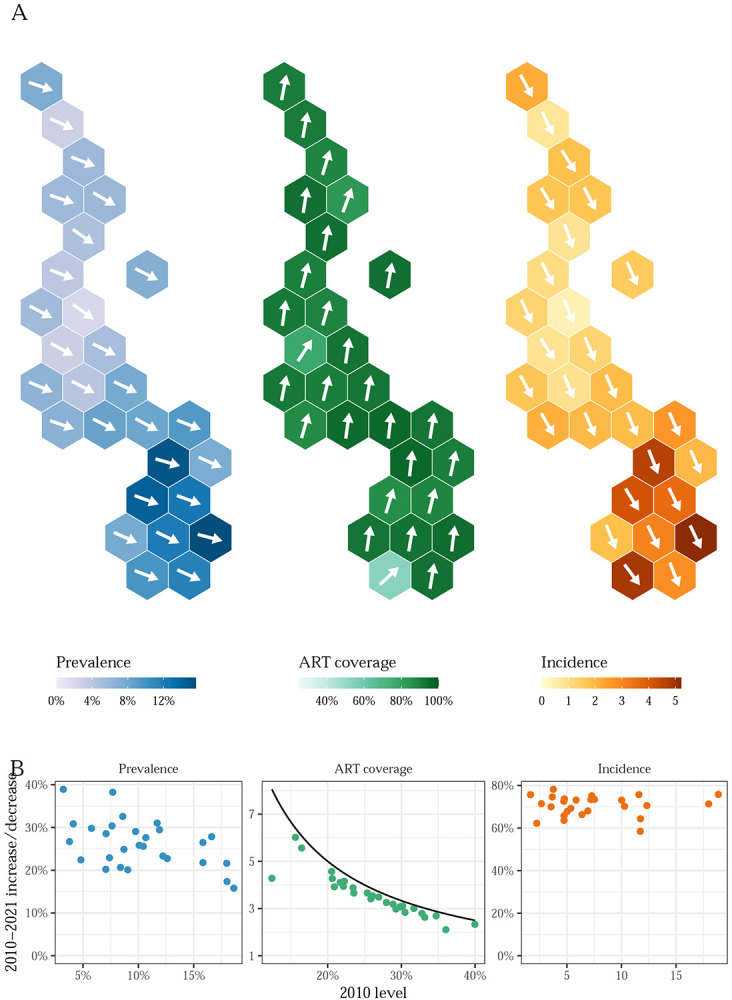
A) Hexagonal tile maps present district-level HIV prevalence, ART coverage, and HIV incidence among adults aged 15-49 in Malawi in 2021. The angle of each arrow corresponds to the district-level percent change in each indicator relative to the theoretical maximum change from the 2010 baseline. Upward and downward pointing arrows indicate increases and decreases, respectively. The theoretical maximum change in prevalence and incidence is a 100% decrease, and the maximum change in ART coverage is the percent change needed to reach 100% coverage from the 2010 level. B) Scatter plots comparing the level of each indicator in 2010 to change between 2010 and 2021. Change is x-fold increase for ART coverage and percent decrease for prevalence and incidence.