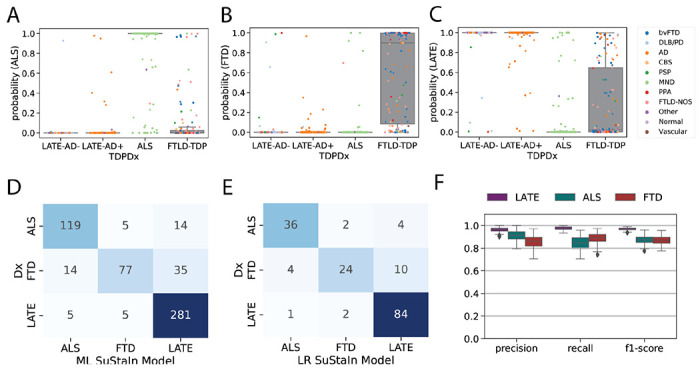
Figure 4: Pathology-based disease classification.

All three diagnostic models were applied to all individuals regardless of TDP-type or genetic group, and the probability of the maximum likelihood stage was recorded. This probability represents a proxy for how well the individual’s regional TDP-43 pattern fit the model trajectory for LATE-NC/ALS/FTLD-TDP. Boxplots in (A-C) show the distribution of probabilities for each of the three diagnostic models (x-axis), stratified by pathological diagnosis (TDPDx on the x-axis), for (A) the ALS model, (B) the FTLD-TDP model and (C) the LATE-Nc model. Note that each graph (A-C) includes a probability for every subject. Note also that probabilities were derived using 10-fold cross-validation for within-diagnosis assessments (e.g. ALS cases tested using the ALS model) to avoid over-fitting. Each individual is colored in accordance with their clinical diagnosis. Generally, individuals showed a high probability in models trained on their diagnosis, and a low probability in others. (D) A confusion matrix showing agreement between pathological diagnosis and maximum likelihood (ML) subtype model. True pathological diagnosis labels are represented on the y-axis, while predicted labels are shown on the x-axis. Individual pathological profiles tended to agree best with models fit to their clinical diagnostic group, but this was not true in all cases. (E) A logistic regression (LR) model was trained on the probabilities, plus ML SuStaIn stage and age at death, using 100 iterations of train/test splits. The confusion matrix shows the average agreement between pathological diagnosis and predicted subtype in the 100 left-out test groups. (F) Distribution of classification statistics for performance of the ML model across the 100 train/test splits, stratified by pathological diagnosis. See Table S3 for further statistics and comparison with ML model.
