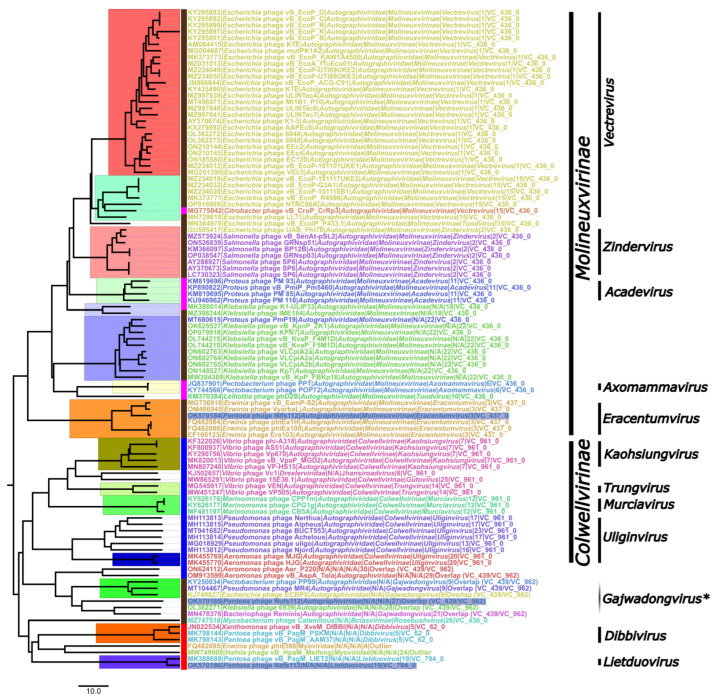
Figure 5.
The NJ tree from a pairwise intergenomic distance matrix generated by VIRIDIC for a dataset comprising the studied phages and their first neighbors identified by the vConTACT2 analysis (n = 103). The tree is midpoint rooted and drawn to scale; the scale bar represents 10% genome nucleotide sequence divergence. Tip labels follow the format of “Genome accession|Phage|Family|Subfamily|Genus|VIRIDIC genus cluster (at least 70% intergenomic similarity)|vConTACT2 status or cluster”. Tip labels of the studied phages are highlighted in blue. The taxonomical information was retrieved from the genome accession-associated metadata at the time of writing. Black bars after the tips show phage subfamily- and genus-level annotations, where two or more corresponding rank phages were neighbors in the tree. Monophyletic clades corresponding to VIRIDIC genus-level clusters are also highlighted by arbitrarily colored rectangles in the tree. The color of the rectangle between the external leaf of the tree and the corresponding tip indicates the “first neighbor” status regarding the studied phages based on the vConTACT2 analysis and is as follows: brown—Nifs112 and Nufs112; magenta—Nifs112; blue—Nufs112; red—Nafs113.

