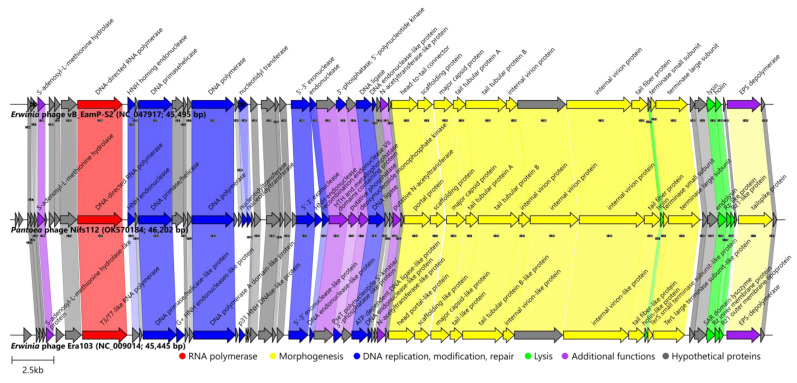
Figure 6.
Genome organization and proteome content comparison of Pantoea phage Nifs112 to its closest relatives. Genomes are drawn to scale; the scale bar indicates 2500 base pairs. Arrows representing open reading frames point in the direction of the transcription and are color-coded based on the function of their putative product according to the legend. Slanted labels above the arrows indicate the predicted function for the given ORF putative product in the case where it had a function assigned (original annotations from downloaded GenBank files were retained). Ribbons connect phage proteins sharing >30% amino acid sequence similarity and are colored in lighter shades according to the predicted functional group of the respective Pantoea phage Nifs112 ORF product. Ribbon labels indicate the similarity between the connected ORF products and ribbons have their fill color opacity set to the percentage similarity between the respective proteins. Asterisks within two of the arrows representing vB_EamP-S2 ORFs indicate that their homologs in Nifs112 were encoded by two distinct ORFs in each case.

