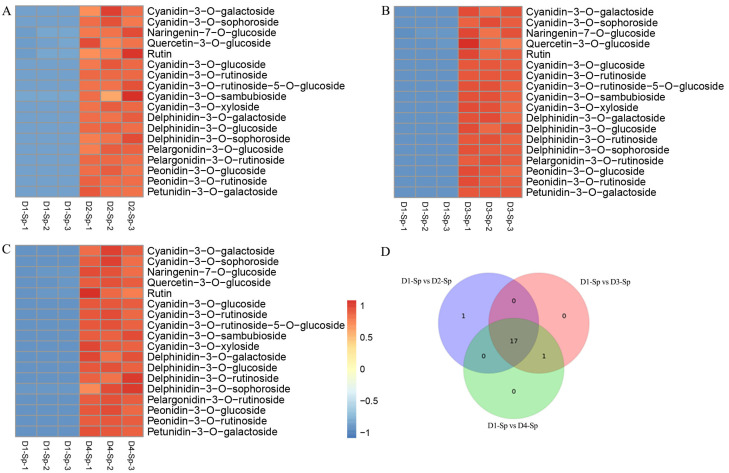
Figure 4.
Differentially accumulated metabolite (DAM) analysis of the metabolome. Heatmaps of DAMs in D1-Sp vs. D2-Sp (A), D1-Sp vs. D3-Sp (B), and D1-Sp vs. D4-Sp (C). (D) Venn analysis of D1-Sp vs. D2-Sp, D1-Sp vs. D3-Sp, and D1-Sp vs. D4-Sp. The color scale from Min (blue) to Max (red) indicates the metabolite contents from low to high. Identification of DAMs between three comparison groups was performed using variable importance in projection values ≥1 and fold change ≥2 or ≤0.5; in addition, the content must be ≥ 1 μg/g DW in spots in at least one stage.

