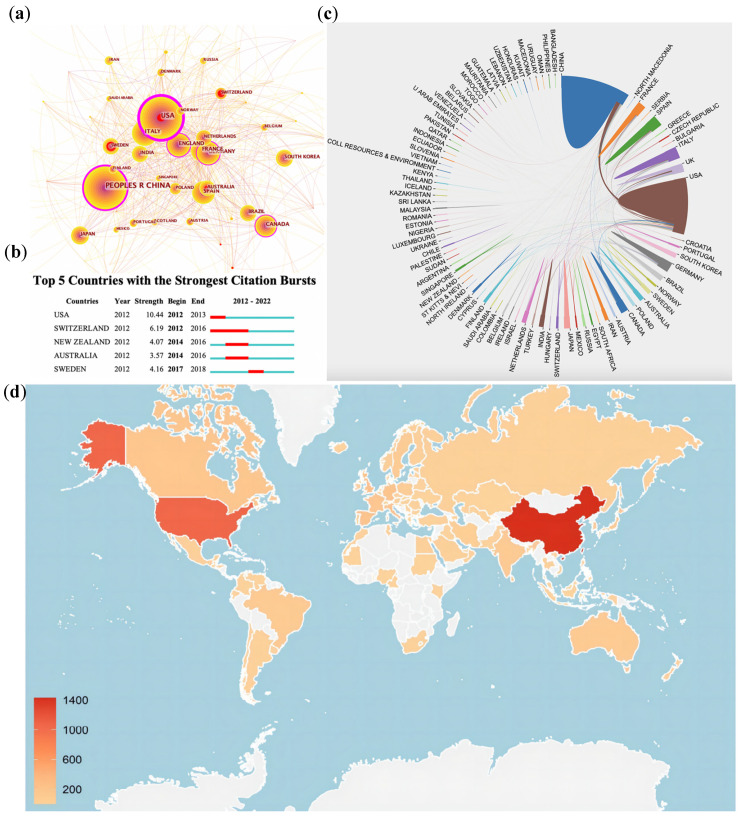
Figure 3.
(a) Analysis of cooperation between main countries of publication. (b) Top 5 countries with the strongest citation bursts. (c) Cooperation network among all countries. (d) Global map showing countries where the articles were published. (a) The size of each node presents its number of documents, and the proportion of the outermost ring means its centrality. Central red circles illustrate nodes’ temporal importance. (b) The strongest citation burst means that a variable changes greatly in a short period. Red bars illustrate the duration of the burst.

