
Fig. 3.
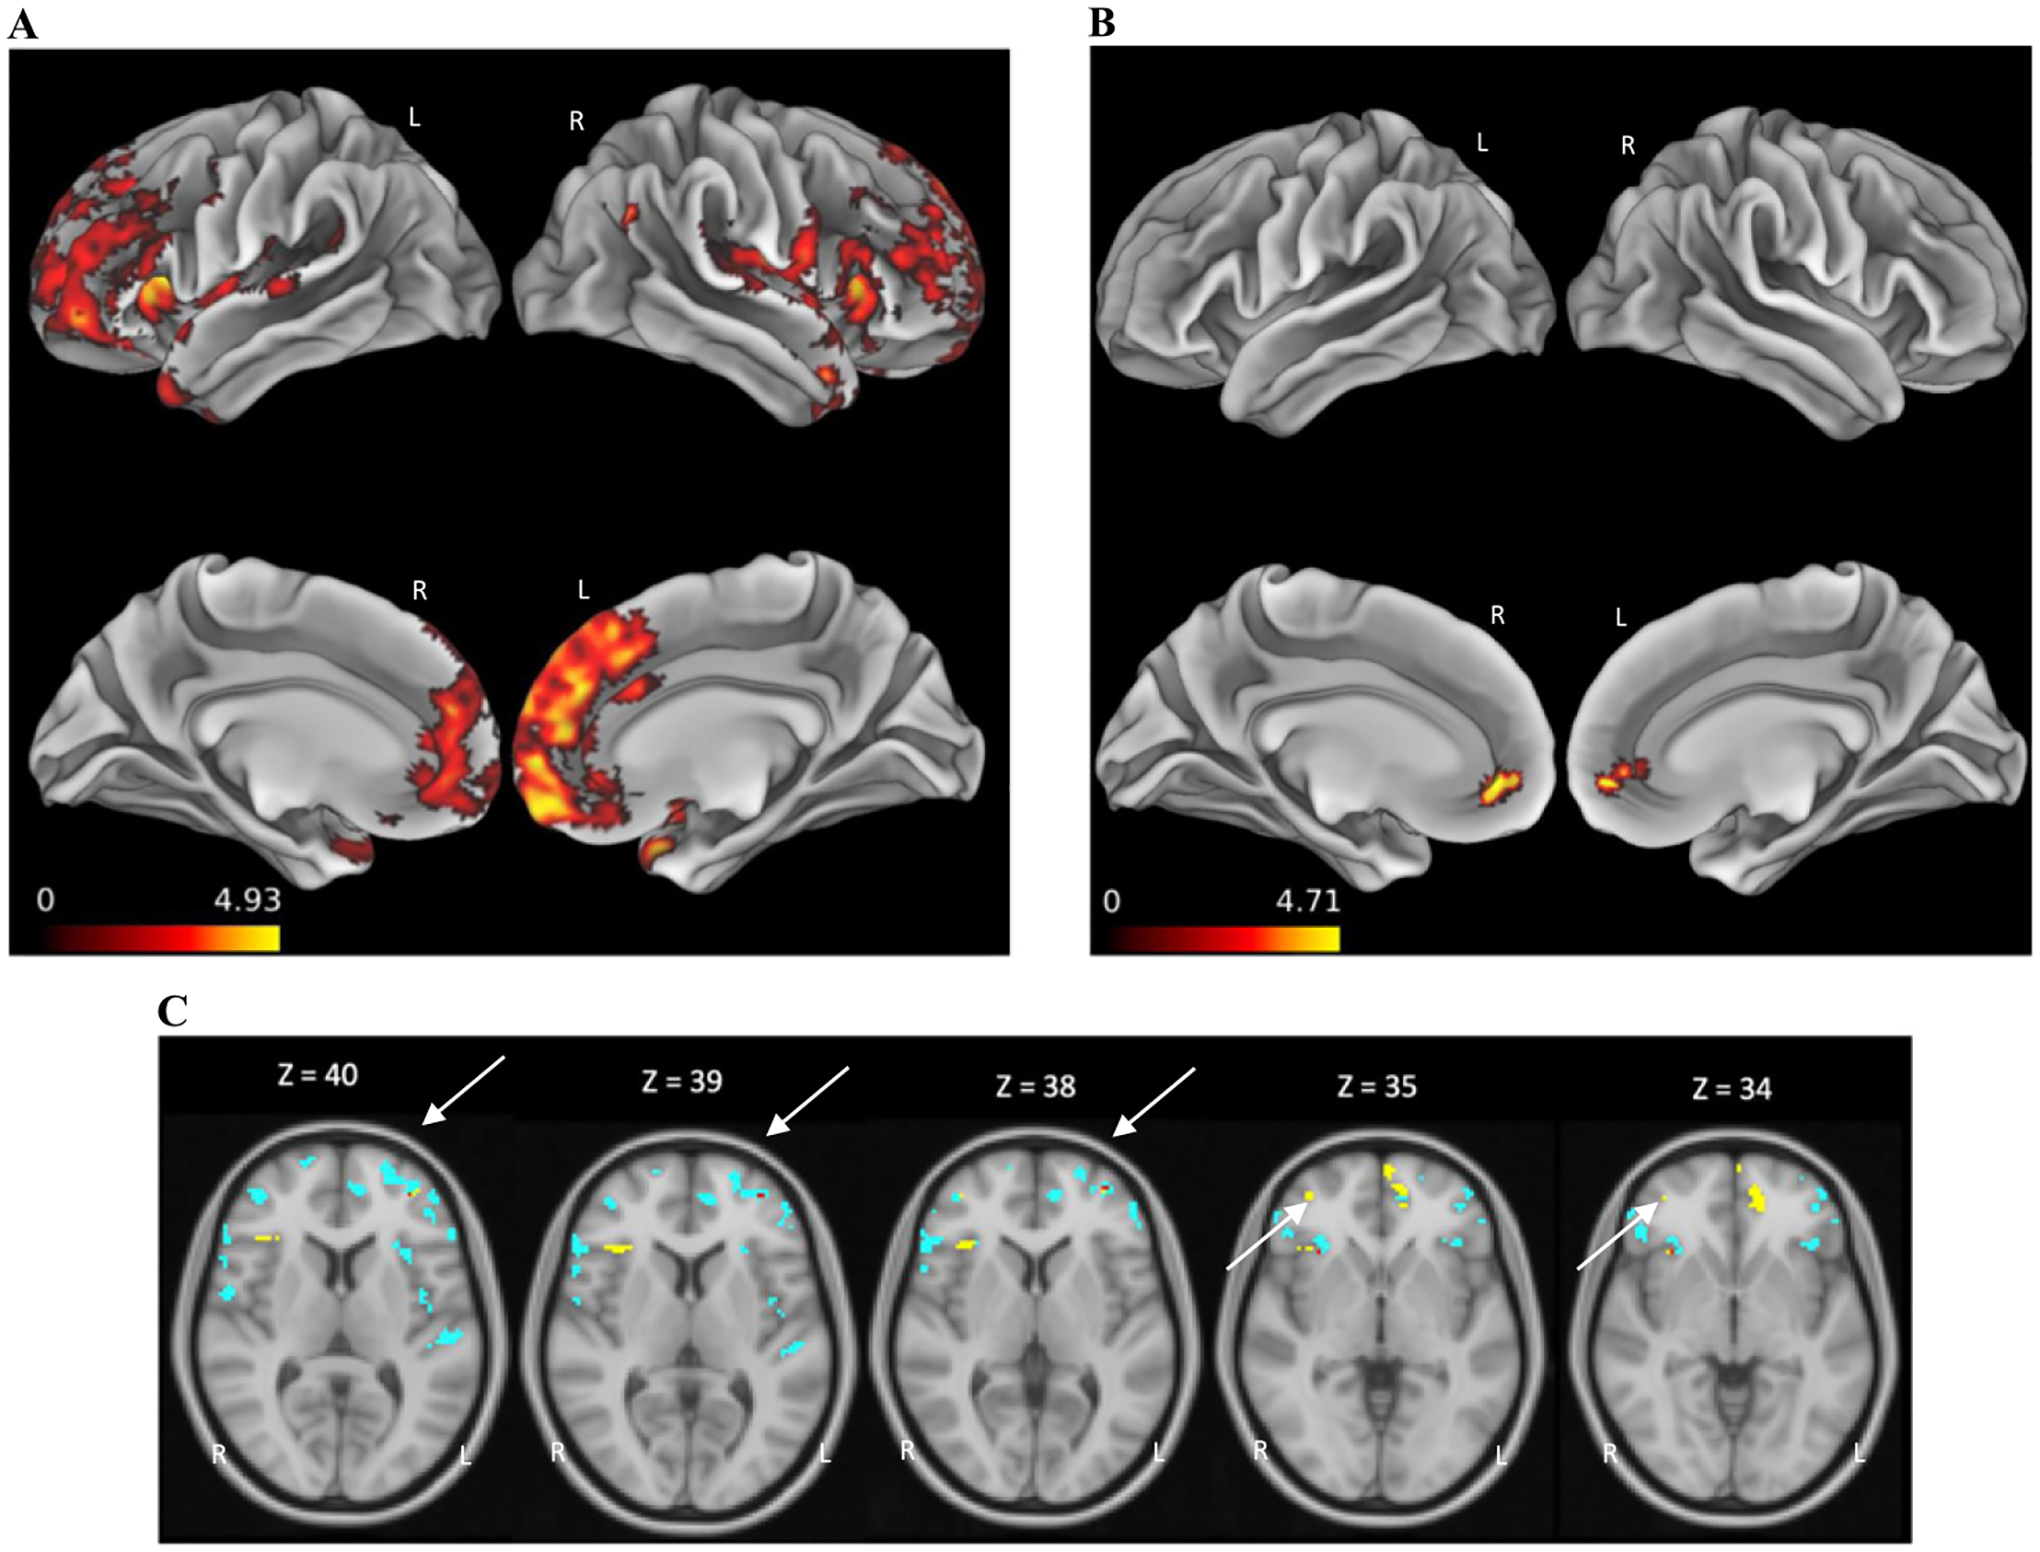
Regions of cortical thinning. Regions of cortical thinning (colored areas) in patients with PSP relative to healthy controls (A) and LBSD (B), and regions related to complex numbers scores (blue), LF (yellow), and both complex numbers scores and LF (red; overlap indicated by arrows) within PSP patient cohort (C).