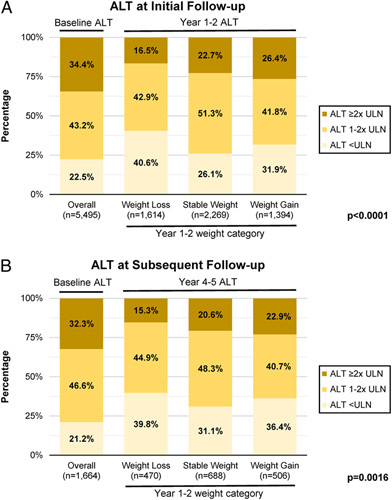
FIGURE 3.

Alanine aminotransferase categories by weight change category at year 1–2 and year 4–5 follow-up in patients with NAFLD. (A) Alanine aminotransferase (ALT) levels at initial follow-up (1–2 y after index date). (B) ALT levels at subsequent follow-up (4–5 y after index date). From left to right, the 4 stacked bars depict the distribution of ALT categories among all patients at baseline (around the index date), patients with weight loss at year 1–2, patients with stable weight at year 1–2, and patients with weight gain at year 1–2. Note that only patients with an ALT level at year 1–2 or 4–5 were included in panels A or B, respectively. ALT categories defined as <ULN (upper limit of normal), 1–2x ULN, and >2x ULN with ULN cutoffs 19 and 30 U/L for women and men, respectively. p-values are for a chi-square test comparing distribution of ALT values at year 1–2 (for A) or year 4–5 (for B), stratified by weight loss category at year 1–2.
