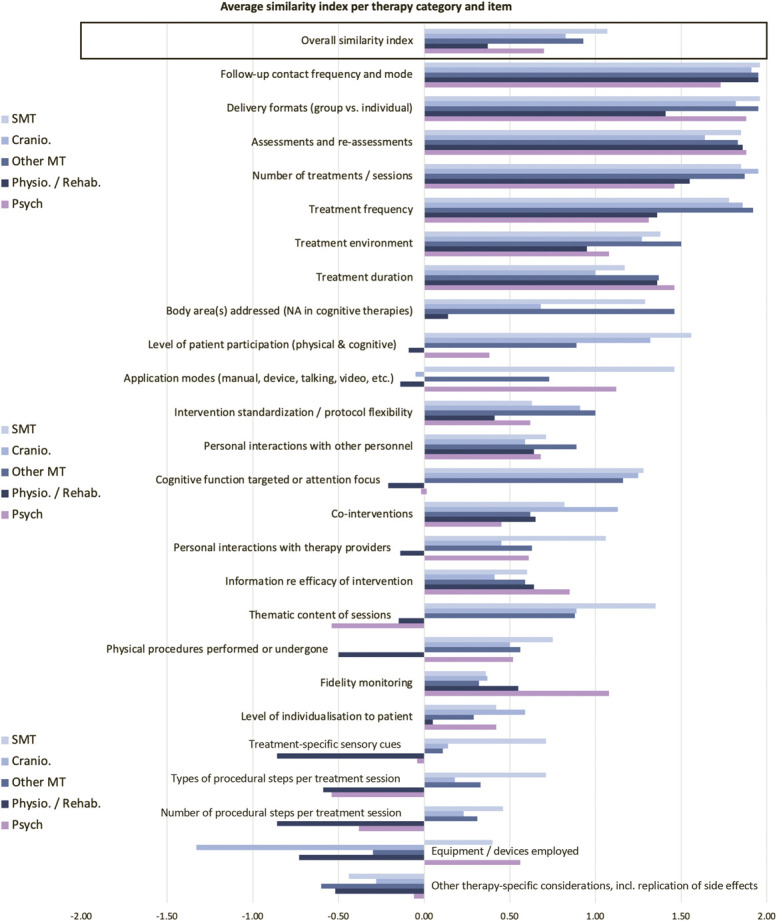
Figure 3.

Average similarity ratings categorised by therapy type, comparing active and control interventions across 25 features. The overall mean across all items is provided in the top row. The end of each bar indicates the average rating. Measures of variability are provided in a supplementary table (supplemental digital content 3, available at http://links.lww.com/PAIN/B673) and the number of trials per group in the overview table 3.
