Figure 1.
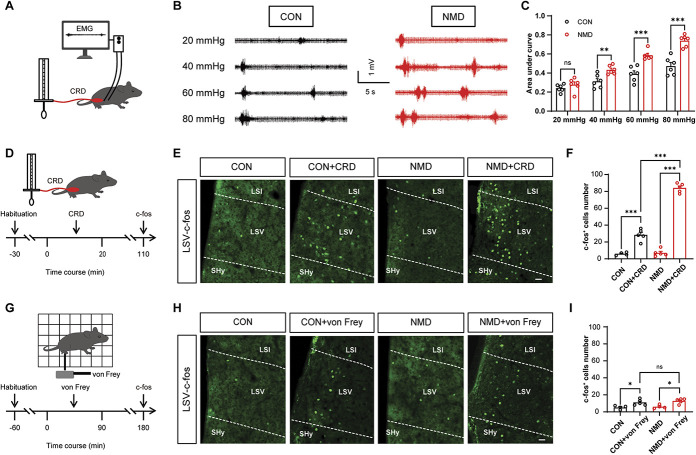
The expression levels of c-fos in the LSV region are significantly increased after CRD stimulation. (A) Schematic of EMG recording for evaluating visceral pain in mice. (B) Representative traces of EMG records. (C) The area under the curve of EMG at 20, 40, 60, and 80 mm Hg in CON and NMD mice (F (3, 15) = 83.68, **P < 0.01, ***P < 0.001, two-way repeated-measure ANOVA followed by Bonferroni post hoc test, n = 6 mice per group). (D) Schematic of c-fos expression evoked by visceral stimulation. (E) Representative images of c-fos–expressed neurons in the LSV region after CRD stimulation. Scale bar, 50 μm. (F) Total number of c-fos–expressed neurons of LSV after CRD stimulation (F (3, 15) = 250.6, ***P < 0.001, one-way ANOVA followed by Tukey post hoc test, n = 4 brain sections from 3 mice for CON, n = 5 brain sections from 3 mice for CON + CRD, NMD and NMD + CRD). (G) Schematic of c-fos expression evoked by mechanical stimulation. (H) Representative images of c-fos–expressed neurons in LSV after von Frey fiber stimulation. Scale bar, 50 μm. (I) Total number of c-fos–expressed neurons of the LSV region after von Frey fiber stimulation (F (3, 14) =8.093, *P < 0.05, one-way ANOVA followed by Tukey post hoc test, n = 4 brain sections from 3 mice of the CON and NMD groups, n = 5 brain sections from 3 mice of the CON + von Frey and NMD + von Frey groups). n.s. indicates nonsignificant differences, P > 0.05. ANOVA, analysis of variance; CRD, colorectal distention; EMG, electromyography; LSV, lateral septal ventral; NMD, neonatal maternal deprivation.

