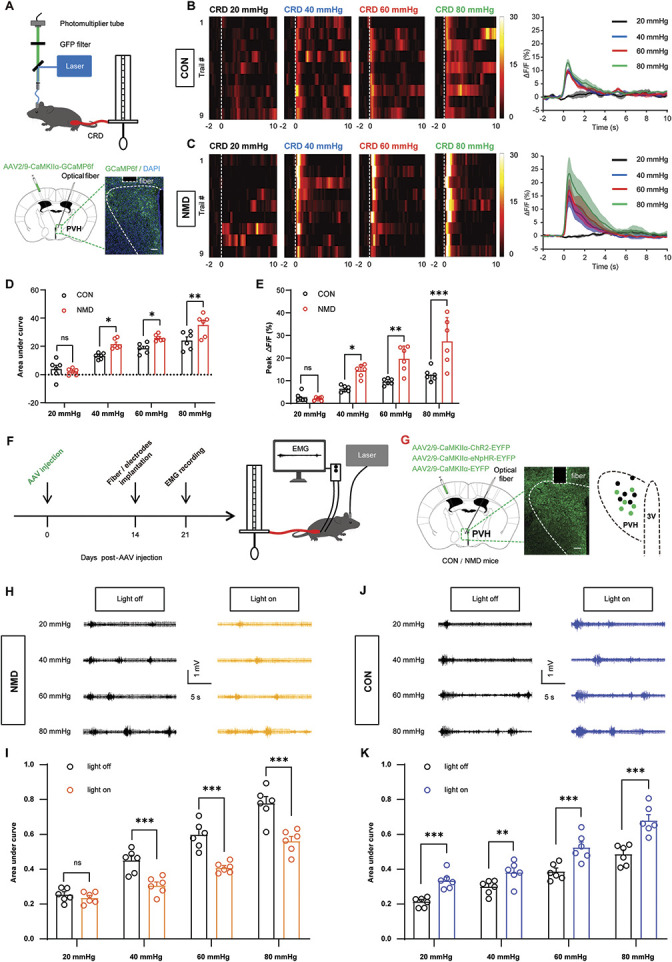
Figure 6.

PVH CaMKIIα-positive neurons are involved in regulating visceral hyperalgesia. (A) Schematic of the recording system for evaluating calcium signals with fiber photometry and visceral pain behavior caused by CRD stimuli (top) and representative image of GCaMP6f expression in PVH CaMKIIα-positive neurons (bottom). Scale bar, 50 μm. (B and C) Heatmap and average Ca2+ transients of PVH CaMKIIα-positive neurons in CON and NMD mice receiving CRD stimulation at 20, 40, 60, and 80 mm Hg, respectively. (D) The area under the curve of calcium activity of PVH CaMKIIα-positive neurons in CON and NMD mice receiving CRD stimulation at 20, 40, 60, and 80 mm Hg, respectively (F (3, 15) = 62.90, *P < 0.05, **P < 0.01, two-way repeated-measure ANOVA followed by Bonferroni post hoc test, n = 6 mice per group). (E) Averaged peak ΔF/F of calcium activity of PVH CaMKIIα-positive neurons in CON and NMD mice receiving CRD stimulation at 20, 40, 60, and 80 mm Hg, respectively (F (3, 15) = 72.94, *P < 0.05, **P < 0.01, ***P < 0.001, two-way repeated-measure ANOVA followed by Bonferroni post hoc test, n = 6 mice per group). (F) Experimental procedure of optogenetic manipulation of PVH CaMKIIα-positive neurons (left) and schematic of EMG recording for evaluating visceral pain (right). (G) Representative image of viral expression in PVH CaMKIIα-positive neurons (left) and summary view of fiber tip and injection site (right). Black dots and green dots indicate the fiber tip and injection site, respectively. Scale bar, 50 μm. (H) Representative EMG traces of NMD mice were recorded at 20, 40, 60, and 80 mm Hg, respectively. (I) The area under the curve of EMG at 20, 40, 60, and 80 mm Hg in NMD mice (F (3, 15) = 57.67, ***P < 0.001, two-way repeated measure ANOVA followed by Bonferroni post hoc test, n = 6 mice per group). (J) Representative EMG traces of CON mice were recorded at 20, 40, 60, and 80 mm Hg, respectively. (K) The area under the curve of EMG at 20, 40, 60, and 80 mm Hg in CON mice (F (3, 15) = 43.84, **P < 0.01, ***P < 0.001, two-way repeated-measure ANOVA followed by Bonferroni post hoc test, n = 6 mice per group). White dotted frame indicates the optical fiber trace. n.s. indicates nonsignificant differences, P > 0.05. See also Figure S4, available at http://links.lww.com/PAIN/B695. ANOVA, analysis of variance; CRD, colorectal distention; LSV, lateral septal ventral; NMD, neonatal maternal deprivation; PVH, paraventricular hypothalamic.
