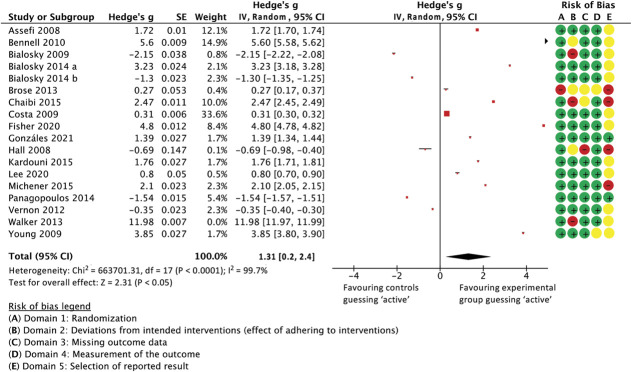
Figure 13.
Forest plot showing all studies for which the Bang BI could be calculated. The ratio between BI in active and control groups is presented as Hedge's g, with values near 0 indicating that participants in both groups were likely to make similar guesses as to which treatment they received (ie, were adequately blinded). Values below 0 indicate that patients in the sham arm believed disproportionately more that they were in the active arm than those in the actual active group (indicating higher sham credibility), and values to the right indicating that the active treatment made more patients think that they had a real treatment than the sham treatment in the same study (in other words, fewer sham-arm patients believed that theirs was a real treatment than active-arm patients did about their intervention, indicating unsuccessful blinding). An extreme outlier (Walker et al., 2013)69 is shown in the forest plot but does not feed into the meta-analysis (weight = 0%).

