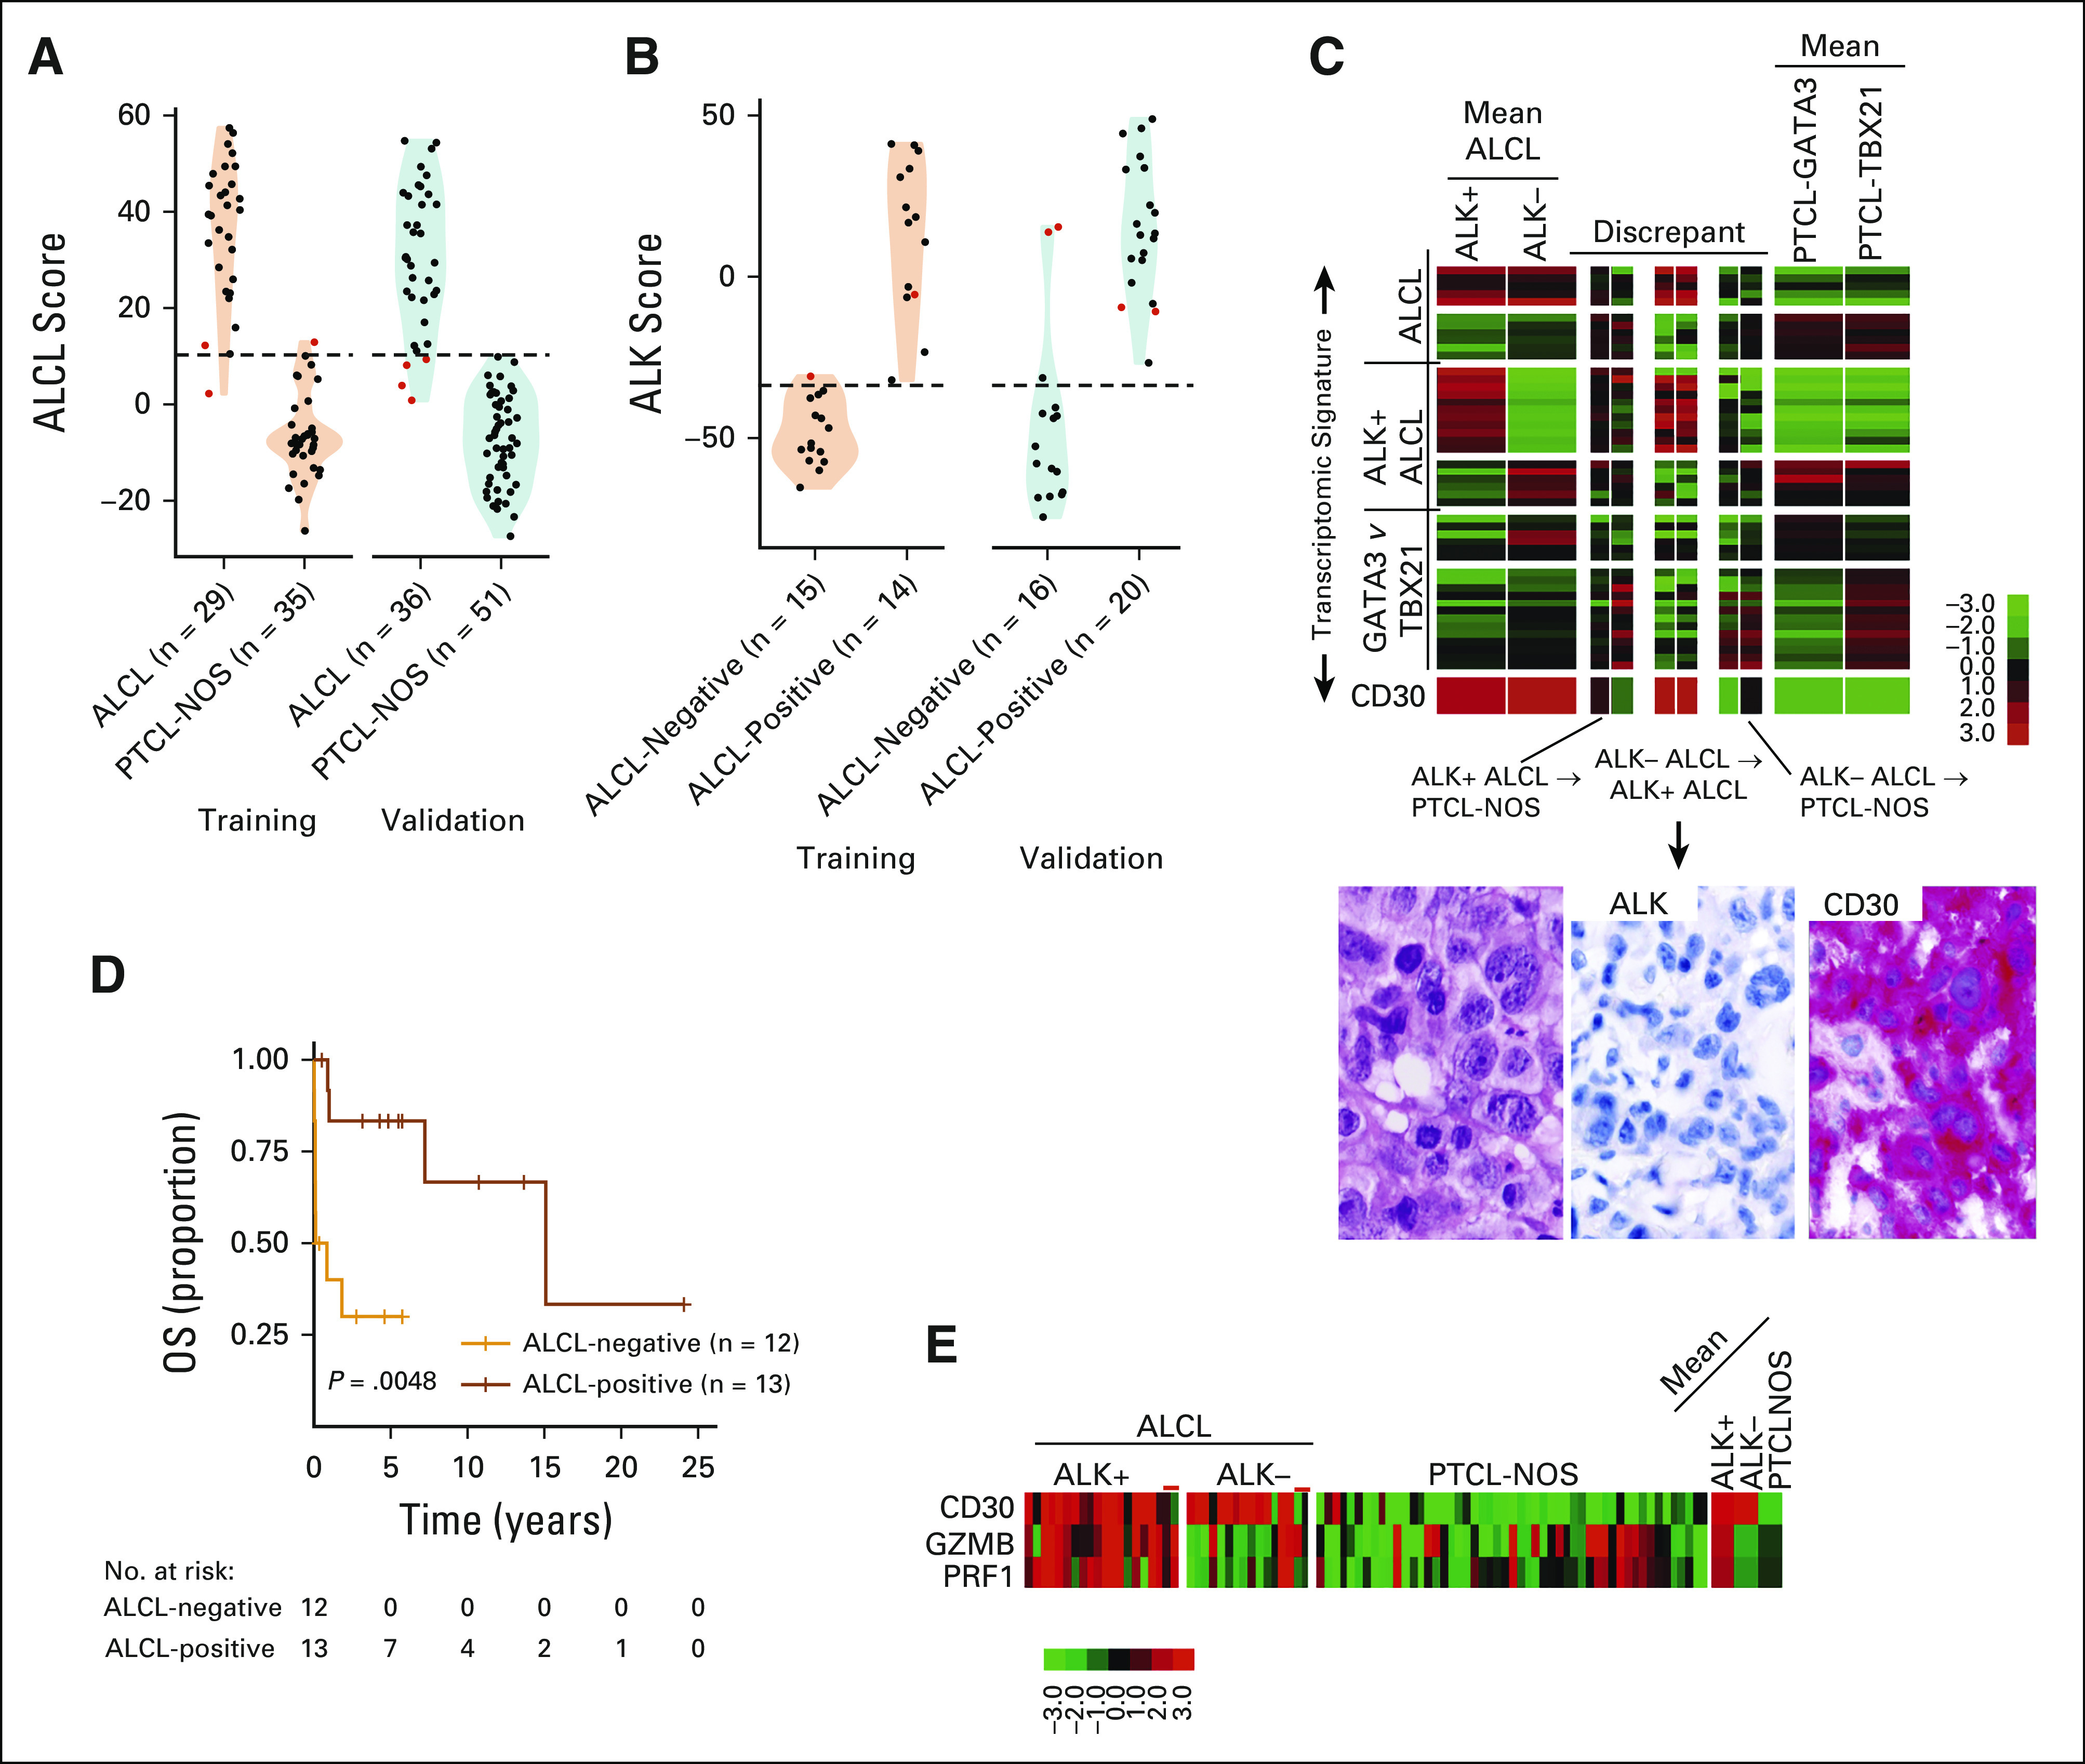
FIG 3.

ALCL classification. (A) Violin and dot plot of ALCL classification scores versus PTCL-NOS. (B) ALK-positive ALCL versus ALK-negative ALCL on the nCounter platform. Cases that were discordant between ALCL and PTCL-NOS or ALK-negative and ALK-positive are given in red. (C) Heatmaps of ALK-negative and ALK-positive ALCL cases showing disagreement by NanoString classification in the validation cohort. H&E and CD30 and ALK immunostains of a representative ALK-negative ALCL case that was classified as ALK-positive ALCL by NanoString assay are shown (400×). (D) Kaplan-Meier curve of OS of ALCLs in the training and validation cohort by NanoString classification. (E) Heatmap of CD30 and cytotoxic transcript expression in ALCL and PTCL-NOS cases. Discrepant cases are noted with red lines. ALCL, anaplastic large cell lymphoma; H&E, hematoxylin and eosin; NOS, not otherwise specified; OS, overall survival; PTCL, peripheral T-cell lymphoma.
