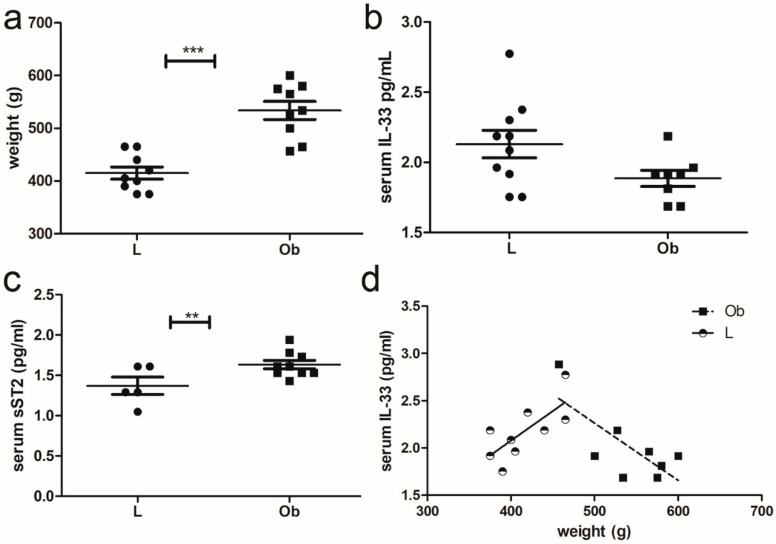
Figure 1.
Characterization of IL-33 signaling in ZF rats: (a) Graphs showing the weight of rats at sacrifice (*** p < 0.001), (b) ELISA assay of serum IL-33. (c) ELISA assay of ST2 serum levels and (d) graph showing an opposite correlation between IL-33 and weight in Lean (** p < 0.01) versus Obese rats. Student’s t-test: ** p < 0.01; *** p < 0.001. Full square stands for Obese rats, while full circle stands for Lean rats.

