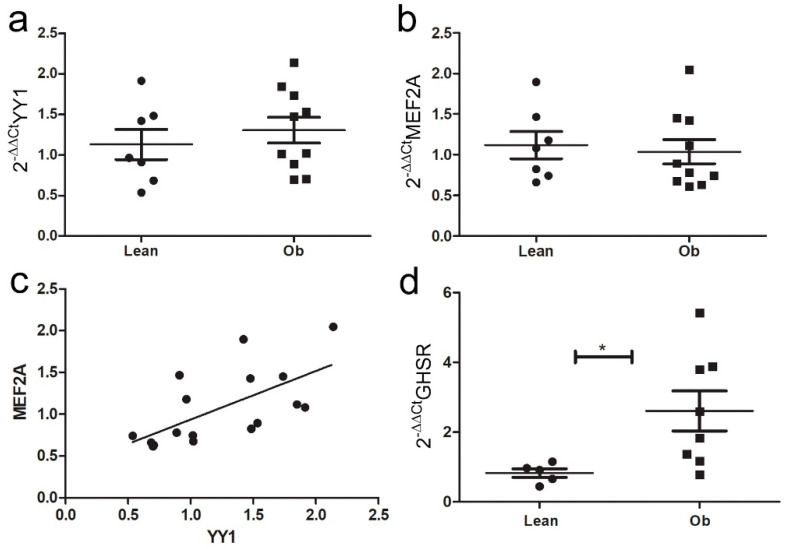
Figure 8.
Ghrelin-induced pathway analysis in ZR cardiac biopsies. Graphs showed qPCR of (a) YY1 and (b) MEF2A expression in cardiac biopsies of ZR: (c) a positive correlation was observed between MEF2A and YY1 in cardiac biopsies of ZR. (d) GHSR mRNA was greatly increased in vivo in obese ZR (* p < 0.05). Student’s t-test: * p < 0.05. Full square stands for Obese rats, while full circle stands for Lean rats.

