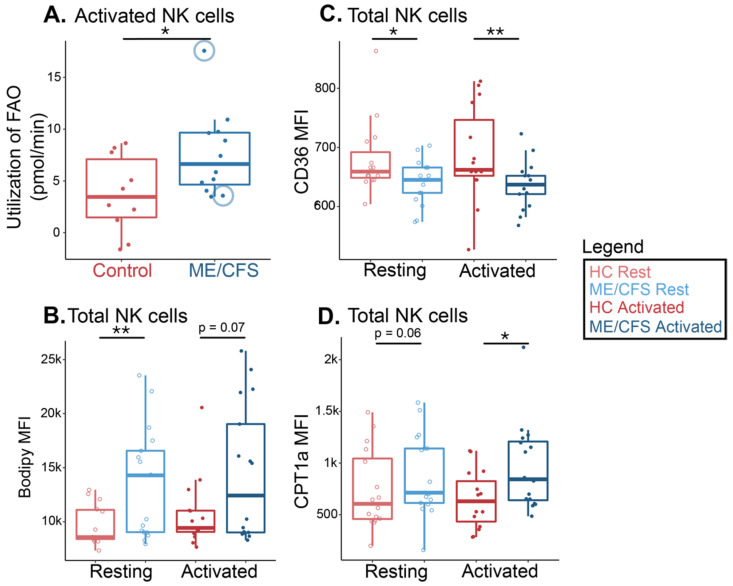
Figure 4.
ME/CFS NK cells increased fatty acid oxidation compared to healthy controls. (A) Fatty acid oxidation measurements from a Seahorse extracellular flux analysis of stimulated NK cells (n = 10 healthy control samples; n = 12 ME/CFS samples). Each dot represents the change in oxygen consumption rate (pmol/min) under high energy demands following the injection of a fatty acid oxidation inhibitor (etomoxir) in one sample, with an average of 2–3 technical replicates. The blue circles around two of the data points indicate one patient at two different time points (B) Mean fluorescence intensity of a supplied fatty acid (Bodipy) in resting and activated NK cells (n = 14 healthy control samples at rest; n = 17 ME/CFS samples at rest; n = 15 healthy control samples after activation; n = 17 ME/CFS samples after activation, [n = 14/17/15/17]). (C) Median fluorescence intensity of a fatty acid cell membrane transporter, CD36, in resting and activated NK cells (n = 15/17/15/17). (D) Median fluorescence intensity of a fatty acid mitochondrial transporter, CPT1a, in resting and activated NK cells (n = 16/17/15/16). Box plots represent the median ± 25th and 75th quartiles. Whiskers represent 1.5× the interquartile ranges. Outliers are values outside the whisker range. Healthy control and ME/CFS data points are light (resting) or dark (activated) red or blue, respectively. For Seahorse data, * p < 0.05 by Wilcoxon rank-sum test. For flow cytometry data, * p < 0.05, ** p < 0.01 by Kruskal–Wallis followed by Dunn’s test with FDR-based multiple testing correction.

