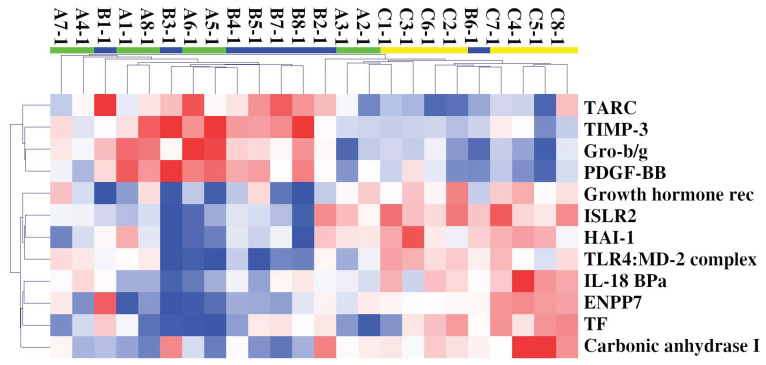
Figure 1.
HC of 24 samples and 12 circulating deregulated proteins in ALS (F-ALS samples in green and S-ALS ones in blue) patients compared with H-CTR (in yellow). Pearson correlation was used as similarity metrics and the average as a linkage method. In the HC colormap, red denotes upregulation, and blue denotes downregulation. Each rectangle refers to the standardized expression across all samples, which is the expression level minus the row median divided by the row’s standard deviation. The relative color scheme uses the minimum (−2.0) and maximum (2.0) values in each row to convert values to colors. Abbreviations: Growth hormone rec = Growth hormone receptor.

