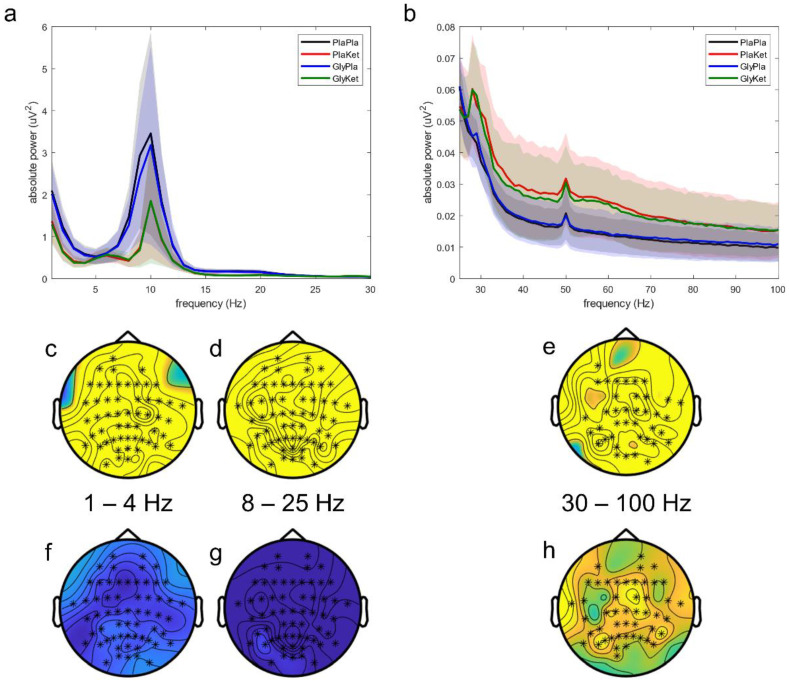
Figure 2.
Mean resting state EEG power spectra across all electrodes in (a) the frequency range 1–30 Hz and (b) the frequency range 25–100 Hz for all four conditions: the PlaPla (black line), PlaKet (red line), GlyPla (blue line), and GlyKet condition (green line). The shaded areas depict the corresponding standard deviation of each condition. Topographical representation of statistical differences among all four conditions (significantly different electrodes marked as asterisks) found in three clusters: (c) 1–4 Hz; (d) 8–25 Hz; (e) 30–100 Hz. Corresponding main effect analyses for ketamine reveal activity decreases in the 1–4 Hz (f, not significant) and the 8–25 Hz (g) clusters, but activity increases in the 30–100 Hz cluster (h) (significantly different electrodes marked as asterisks).

