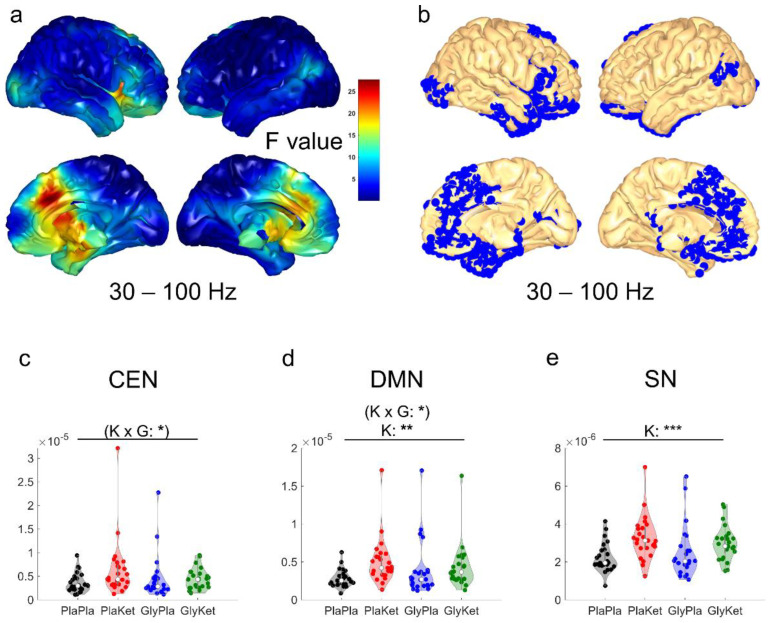
Figure 3.
(a) Cortical map with F-values obtained by voxel-wise main effect analyses for ketamine of source activity computed as exact low-resolution brain electromagnetic tomography (eLORETA) in the gamma frequency band (30–100 Hz). (b) Blue voxels depict corresponding significantly increased (pFDR < 0.05) source activity during the administration of ketamine in three large clusters. Violin plots of the mean network source-localized gamma (30–100 Hz) power of all regions of interest (ROI) in the central executive network (CEN); (c), the default mode network (DMN); (d), and the salience network (SN); (e) for all four conditions: the PlaPla (black dots), PlaKet (red dots), GlyPla (blue dots), and GlyKet condition (green dots). (K × G: ketamine × glycine interaction term; K: ketamine main effect; * p < 0.05; ** p < 0.01, *** p < 0.001; effects that were no longer significant after FDR correction are shown in parentheses).

