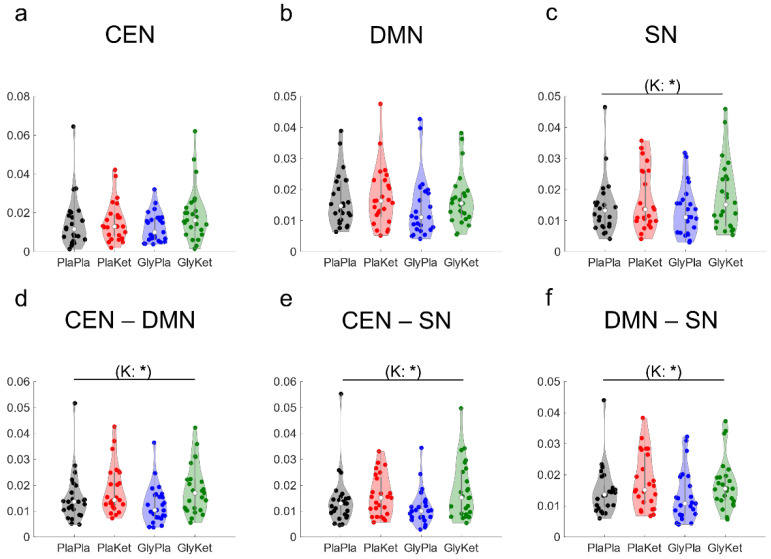
Figure 4.
Violin plots of the mean intra-network gamma (30–100 Hz) functional connectivity (computed as lagged coherence) among all regions of interest (ROI) in the central executive network (CEN); (a), the default mode network (DMN); (b), and the salience network (SN); (c) for all four conditions: the PlaPla (black dots), PlaKet (red dots), GlyPla (blue dots), and GlyKet condition (green dots). Inter-network connectivity is displayed as mean lagged coherence between all ROIs of the CEN and the DMN (d), between all ROIs of the CEN and the SN (e), and between all ROIs of the DMN and the SN (f). (K: ketamine main effect; * p < 0.05; effects that were no longer significant after FDR correction are shown in parentheses).

