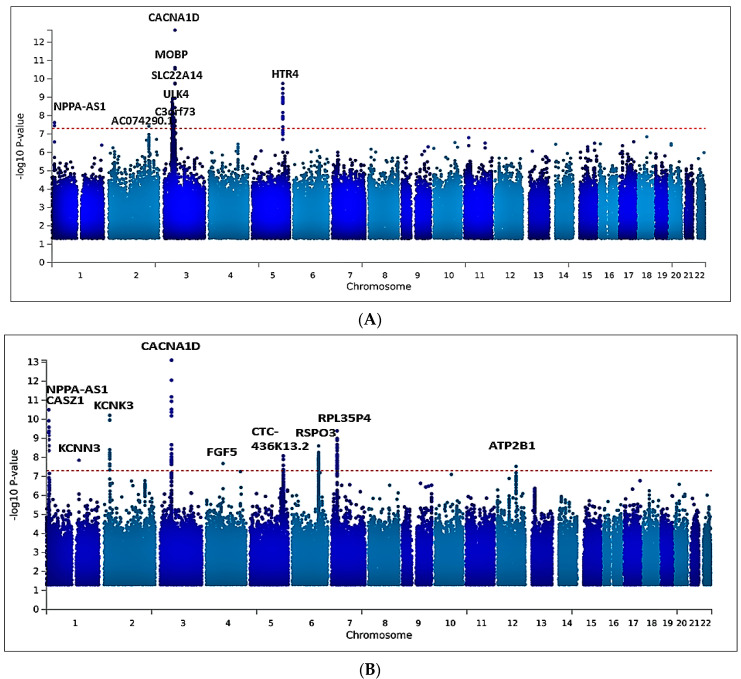
Figure 2.
Manhattan plots showing the minimum p-value for the association across (A) DBP and (B) SBP blood pressure traits, computed using inverse-variance fixed-effect meta-analysis from 75,850 individuals. Each point on the Manhattan plots denotes a variant, with the X-axis representing the genomic position and the Y-axis representing the association level −log 10 (p-value). The horizontal red line shows the genome-wide significance threshold p-value = 5 × 10⁻⁸.

