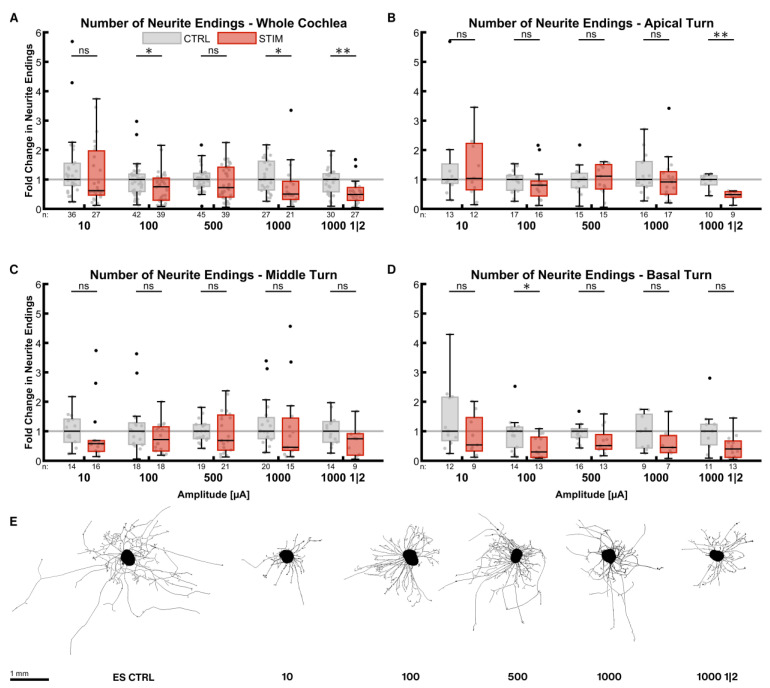
Figure 3.
Number of neurite endings after electrical stimulation. The diagrams (A–D) show the fold change of the number of neurite endings regarding the median of the control group after ES with different amplitudes. All groups were supplemented with 25 ng/mL BDNF. The fold change was normalized to the electrically unstimulated controls on the same plate. Therefore, every electrically stimulated group has its own unstimulated control group. 1000 1|2 designates the 1 min on, 2 min off stimulation pattern with 1000 µA amplitude. The groups in the first graph (A) contain an equal number of samples from three turns, hence representing the whole cochlea. Diagrams (B–D) depict the individual turns. (A–D) The boxes extend from the 25% to the 75% percentile. The black bar denotes the median. The whiskers delimit the 1.5-fold interquartile range. Samples within this range are marked as grey dots, and samples beyond this range are black. A grey line marks the median of the control group. The number of samples in each group is written right below the X-axis. The asterisks or ns (not significant) above the groups indicate the significance level of a groupwise Mann–Whitney test, followed by a Holm–Šídák correction against the corresponding control group. (E) Representative explants at the median of the best-performing groups in (A).

