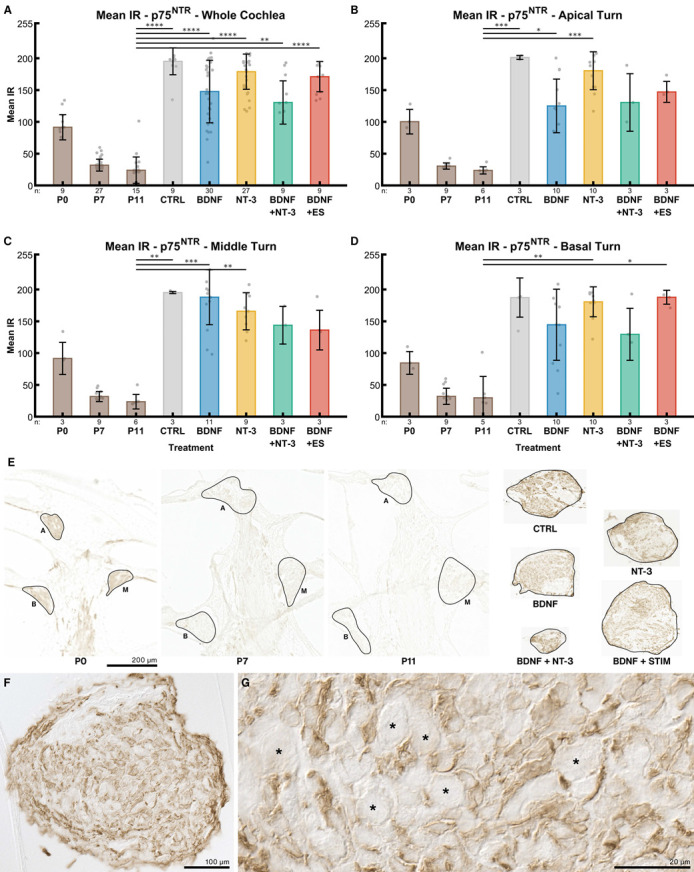
Figure 8.

p75NTR receptor expression. The diagrams (A–D) show the mean IRs of DAB-positive areas of histological sections at different age groups (P0–P11) and explant sections after different treatments (untreated (NT CTRL), 25 ng/mL BDNF, 200 ng/mL NT-3, 25 ng/mL BDNF + 200 ng/mL NT-3 and 25 ng/mL BDNF + 500 µA). The groups in the first graph (A) contain an equal number of samples from three turns, hence representing the whole cochlea. Diagrams (B–D) depict the individual turns. (A–D) The whiskers denote the standard deviation. Individual samples are marked as grey dots. The number of samples in each group is written right below the X-axis. The asterisks or ns (not significant) above the groups indicate the significance level of a Kruskal–Wallis test followed by a Dunn’s multi-comparison post-hoc test. The DAB intensities of P0–P11 pups were tested among themselves, and the treated explants were compared with the control and the P11 group. Non-significant differences are not shown. (E) Representative sections closest to the median mean IR of the groups in (A). The solid black lines mark the regions of interest. A, M and B denote apical, middle, and basal turns, respectively. The explant sections are all from the middle turn. (F) Overview and detail (G) of a 25 ng/mL BDNF-treated explant. SGNs are marked with an asterisk and do not exhibit any IR, while surrounding cells are considerably stained.
