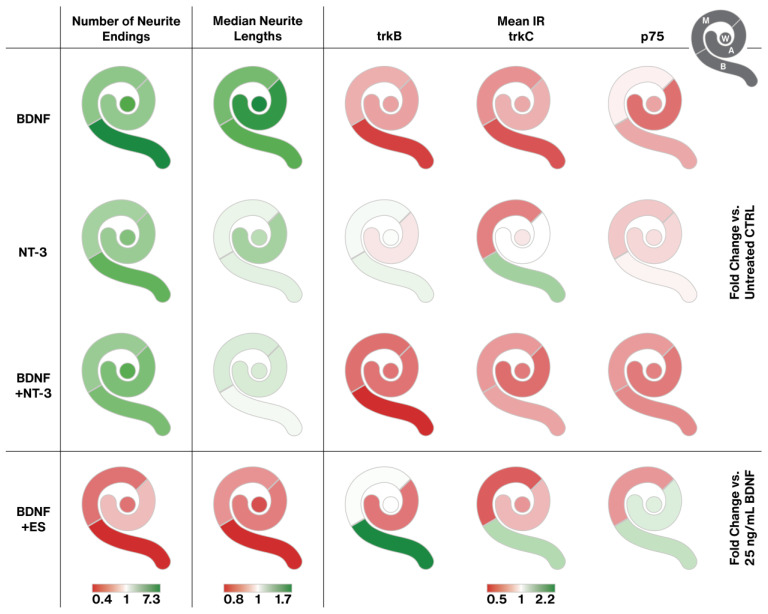
Figure 10.
Graphical representation of the main results. Each cochlea pictogram is separated into four segments, representing apical (A), middle (M), and basal (B) explants, as well as the equally pooled, whole cochlea represented as a circle in the middle (W) (see pictogram in the upper right corner). The three gradients at the bottom determine the color range for the first, second, and last three columns, respectively. Each color visualizes the fold change of the median related to the median of the respective untreated (first three rows) or 25 ng/mL BDNF treated (last row) groups. To minimize the influence of variation, the first two columns contain all equally pooled concentrations or stimulation patterns of each agent (BDNF, NT-3, BDNF + NT-3, or BDNF + ES). For the mean IR of the receptor quantification, only distinct treatments were available (25 ng/mL BDNF, 200 ng/mL NT-3, 25 ng/mL BDNF + 200 ng/mL NT-3, 25 ng/mL BDNF + 500 µA ES).

