Figure 1.
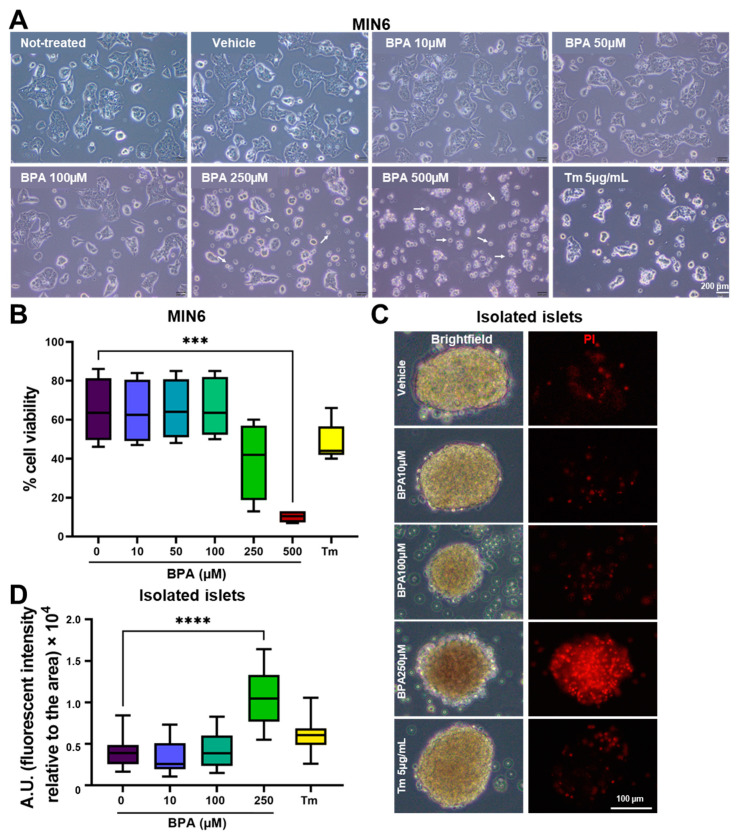
Treatment with increasing concentrations of BPA reduced MIN6 and islet cell viability. (A) Brightfield microscopy images of MIN6 cells after 24 h of treatment with increasing concentrations of BPA (0–500 µM) and with 5 µg/mL Tm, respectively. Apoptotic/dead cells are indicated by arrows. The scale bar is 200 μm. (B) Graph depicting cell viability as determined by flow cytometry analysis upon staining with Annexin V and PI for MIN6 cells treated with BPA (0–500 µM) or with 5 µg/mL Tm. (C) Fresh islets isolated from NOR mice were treated for 24 h with increasing concentrations of BPA (0–250 µM) or 5 µg/mL Tm and stained with PI. Representative brightfield microscopy images (left) and fluorescence microscopy images of the islets labeled with PI (right) after 24 h of various treatments as described above. The scale bar is 100 µm. (D) Graph showing analysis of cell death in the islets (n = 21 per condition) expressed as a ratio of PI fluorescence intensity and islets aria, the y axis represents A.U. *** p < 0.0005, **** p < 0.0001 by One-way ANOVA.

