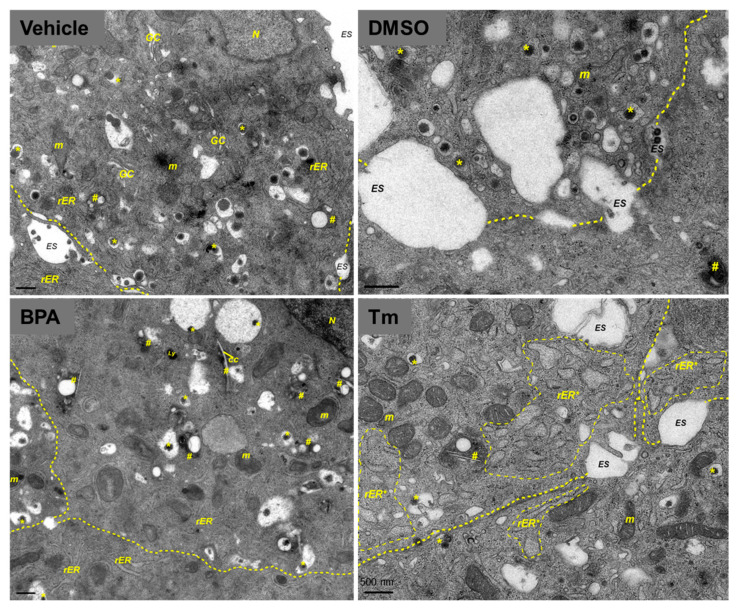
Figure 2.
BPA exposure induces ultrastructural changes in MIN6 β-cells. Transmission electron microscopy images of MIN6 cells cultured for 24 h in the presence of vehicle for BPA (vehicle (ethanol), top left), 100 µM BPA (bottom left), a vehicle for Tm (DMSO, top right), and 5 µg/mL Tm (bottom right). Yellow dotted lines show boundaries between adjacent cells, while lighter yellow dashed lines indicate distended rough endoplasmic reticulum (rER). Insulin granules (*), autophagosomes (#). Note the abundant lipid-like droplets inside autolysosomes and the occurrence of cholesterol crystal (cc) clefts in BPA-exposed cells, suggestive of disturbed lipid metabolism after BPA exposure. The scale bar is 500 nm. N, nucleus; m, mitochondria; Ly, lysosomes; ES, extracellular space.

