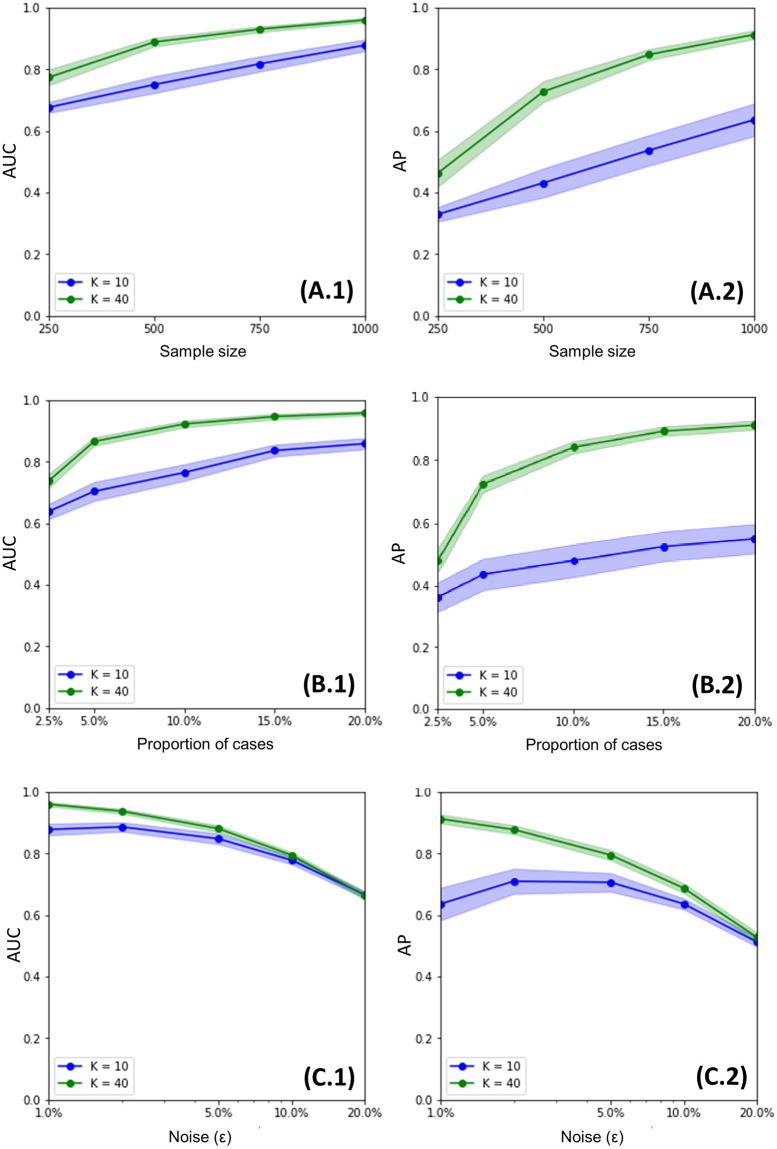
Fig 6. Sensitivity analysis results.
Average performance of hiPRS in terms of AUC and AP for variable sample size (A.1 and A.2), class imbalance (B.1 and B.2) and missing heritability, i.e. noise (C.1 and C.2). Confidence bands are at the 95% level. The x-axis is in logarithmic scale for panels C.1 and C.2.

